> ## Documentation Index
> Fetch the complete documentation index at: https://documentation.onesignal.com/llms.txt
> Use this file to discover all available pages before exploring further.
# In-app message reports
> OneSignal In-App Message delivery and statistics
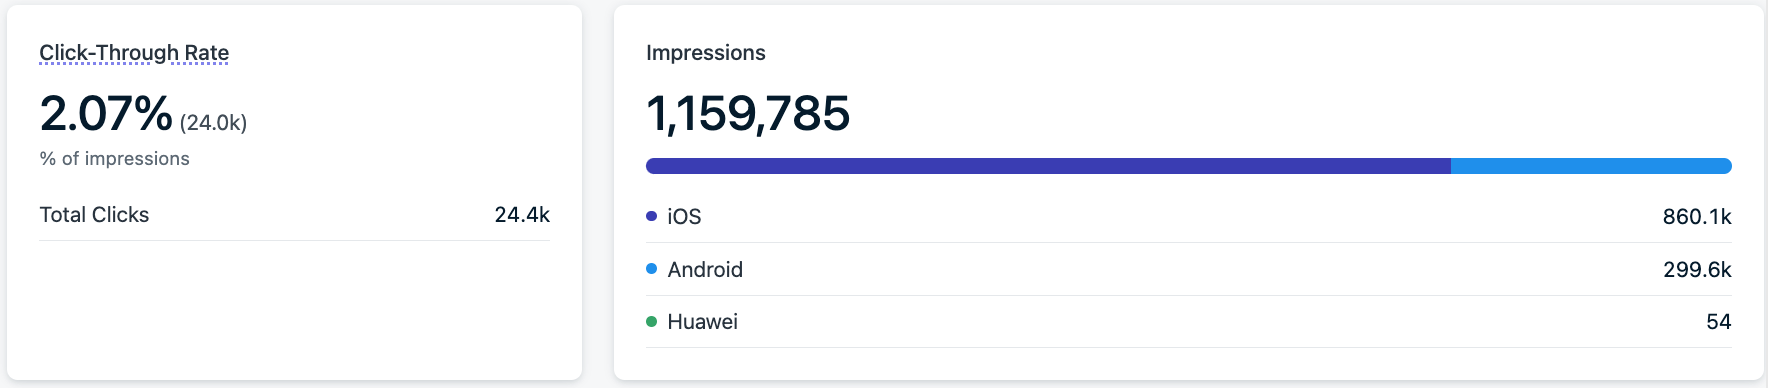
When opening an in-app message report, you will see the high-level statistics for how the in-app message is performing. You can find In-App Message Reports Stats by going to **Messages > In-App** and selecting a message.
 ## Message Statistics
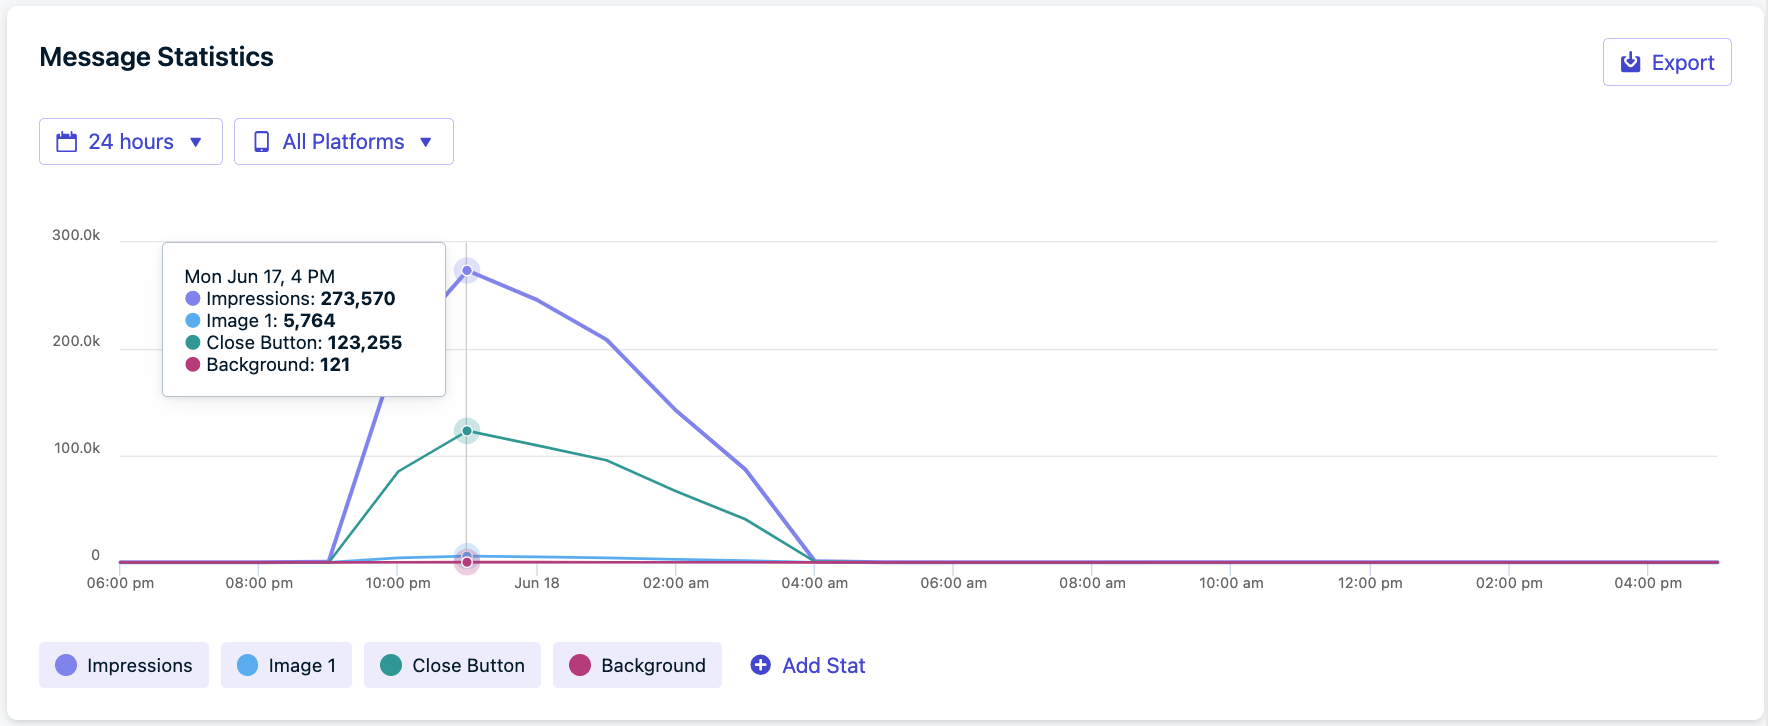
A graph of message events by block over a 30 day, 24 hour, or 1 hour period. This can be filtered by platform and exported via the dashboard.
## Message Statistics
A graph of message events by block over a 30 day, 24 hour, or 1 hour period. This can be filtered by platform and exported via the dashboard.
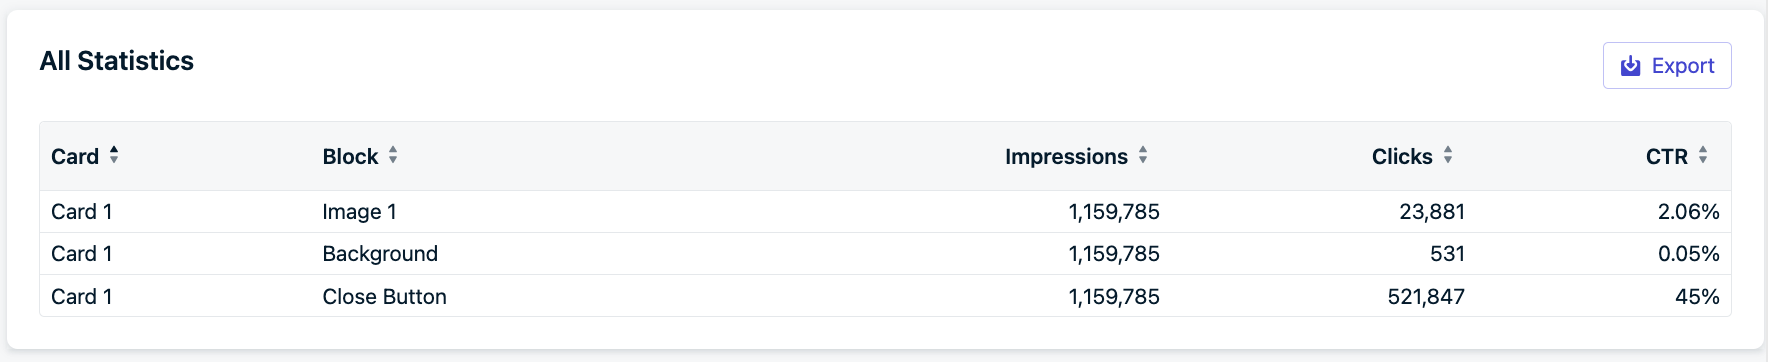
 This data is presented on a per-card, per-block basis. Displaying how many times a block was clicked per card and the click-through rate (CTR).
 ### Metric definitions
| Metric | Definition |
| -------------------- | --------------------------------------------------------------------------------------------------------------------------------------------------------------------------------------------- |
| **Impression** | The number of times an in-app message successfully displayed to a Subscription. Depending on your in-app settings, a single Subscription may register multiple impressions. |
| **Card Impressions** | The number of times a card within a carousel was displayed on a device. A carousel message will have multiple cards, but not all cards may be viewed by each user. Only applies to carousels. |
| **Total Clicks** | The number of times a button block, image block, or background was clicked. It does not include the "Close Button" clicks. |
| **Unique Clicks** | The number of unique clicks across all buttons, images, and backgrounds in the message. Counted once per Subscription. |
For detailed metric definitions across all channels, see the [Metrics Glossary](./analytics-metrics-glossary).
Card is the view or page of the message. Important when using carousels.
Block is the element of the message.
Click-Through Rate is measured by ((Clicks of all blocks - Close Button)/Impressions) \* 100%
## Conversions
**Coming soon** — [Conversion metrics](/docs/en/conversion-metrics) will be available on message reports. Once available, you will see attributed and influenced conversions for each message directly in its report. See [Conversion metrics](/docs/en/conversion-metrics) for details on the attribution model and setup instructions.
***
## Audience activity
The **Audience activity** report shows how each subscription interacted with a specific message. Results are grouped into categories so you can quickly see how recipients engaged.
### Metric definitions
| Metric | Definition |
| -------------------- | --------------------------------------------------------------------------------------------------------------------------------------------------------------------------------------------- |
| **Impression** | The number of times an in-app message successfully displayed to a Subscription. Depending on your in-app settings, a single Subscription may register multiple impressions. |
| **Card Impressions** | The number of times a card within a carousel was displayed on a device. A carousel message will have multiple cards, but not all cards may be viewed by each user. Only applies to carousels. |
| **Total Clicks** | The number of times a button block, image block, or background was clicked. It does not include the "Close Button" clicks. |
| **Unique Clicks** | The number of unique clicks across all buttons, images, and backgrounds in the message. Counted once per Subscription. |
For detailed metric definitions across all channels, see the [Metrics Glossary](./analytics-metrics-glossary).
Card is the view or page of the message. Important when using carousels.
Block is the element of the message.
Click-Through Rate is measured by ((Clicks of all blocks - Close Button)/Impressions) \* 100%
## Conversions
**Coming soon** — [Conversion metrics](/docs/en/conversion-metrics) will be available on message reports. Once available, you will see attributed and influenced conversions for each message directly in its report. See [Conversion metrics](/docs/en/conversion-metrics) for details on the attribution model and setup instructions.
***
## Audience activity
The **Audience activity** report shows how each subscription interacted with a specific message. Results are grouped into categories so you can quickly see how recipients engaged.
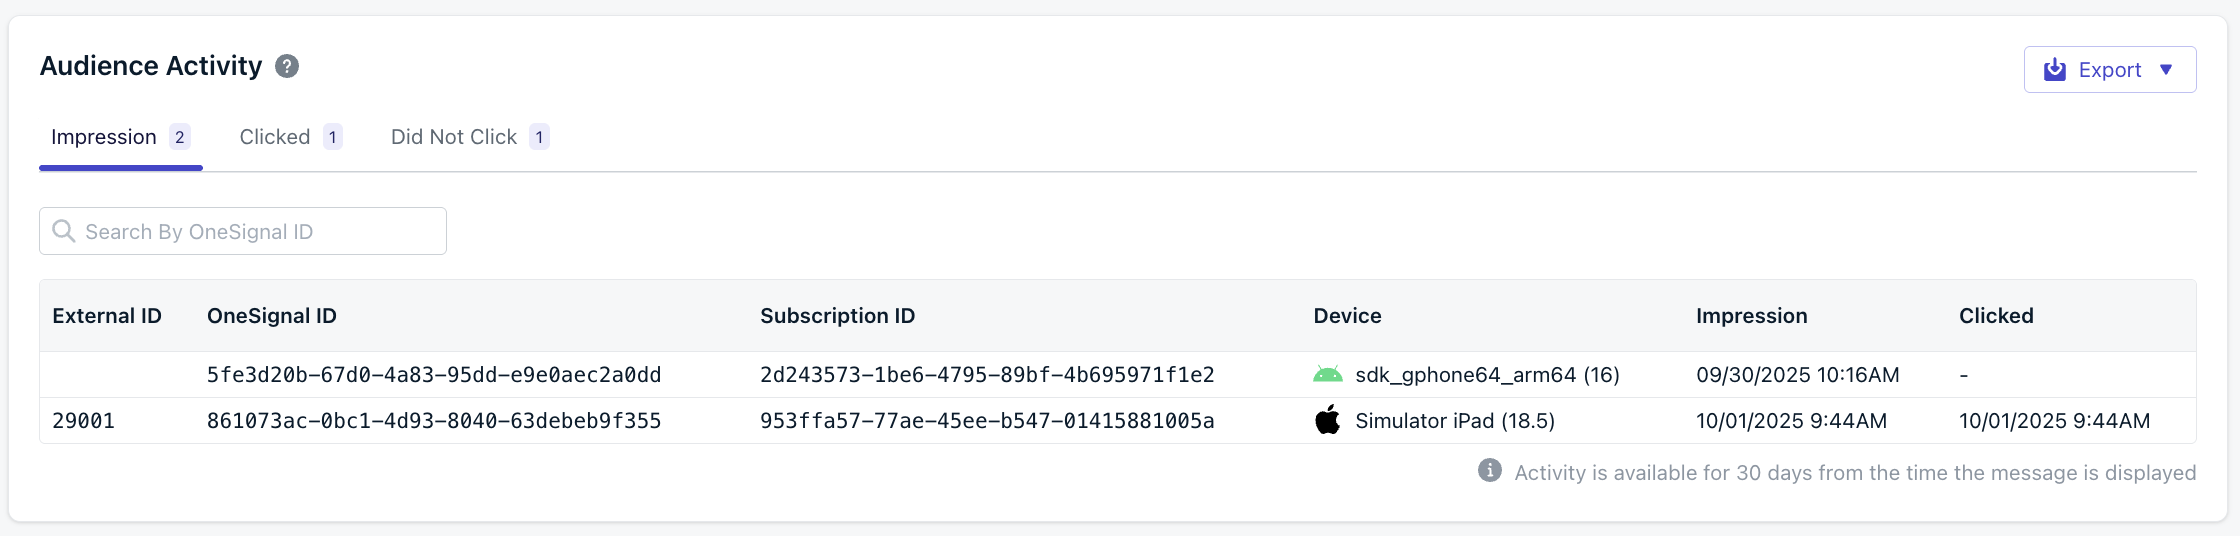 | Category | Description |
| ----------------- | ---------------------------------------- |
| **Impression** | The message was displayed on the device. |
| **Clicked** | User clicked the notification. |
| **Did Not Click** | User did not click the notification. |
Each tab displays the number of recipients in that category and lets you drill into the individual subscription records.
| Column | Description |
| ------------------- | ----------------------------------------------------------------- |
| **External ID** | Your system identifier (if set). |
| **OneSignal ID** | Unique OneSignal user ID. |
| **Subscription ID** | Unique subscription instance (device + app/browser). |
| **Device** | Browser or OS type. If you see `()`, the device has been deleted. |
| **Impression** | Timestamp when the notification was displayed on the device. |
| **Clicked** | Timestamp if the user clicked, or `-` if not. |
Audience activity data is only available for **30 days** from the time the message is displayed. Export results if you need to retain them longer.
***
### Why audience activity is helpful
Audience activity helps you go beyond delivery counts by showing which specific users fall into each outcome. Use it to:
* **Measure engagement** by comparing clicks vs. non-clicks.
* **Diagnose notification visibility** by confirming impressions.
* **Segment audiences** for retargeting or export.
***
### Exporting results
You can download audience data with the **Export** menu:
* **Selected activity** – exports only the currently viewed tab (for example, all users who did not click).
* **All activities** – exports the full report across every category.
Exports let you analyze results offline, share with other teams, or merge with your CRM and analytics tools.
## FAQ
### Why are there fewer clicks than impressions?
* In-App Messages can be "swiped away" or automatically dismissed after a certain amount of time has passed. See [Advanced Settings](./in-app-messages-setup).
### Why are there more clicks than impressions?
* Multiple blocks can be clicked on the same impression of an In-App Message.
### Why do I see "Deleted" blocks?
* If you add/remove/update a card or block of an In-App Message, it will delete the old blocks and add new ones. The old blocks will be labeled with "Deleted" and keep their current impression and click data.
* For example, a "Deleted body", "Deleted Element" and/or "Deleted close\_button" means a change occurred in the IAMs body/text and close blocks.
***
| Category | Description |
| ----------------- | ---------------------------------------- |
| **Impression** | The message was displayed on the device. |
| **Clicked** | User clicked the notification. |
| **Did Not Click** | User did not click the notification. |
Each tab displays the number of recipients in that category and lets you drill into the individual subscription records.
| Column | Description |
| ------------------- | ----------------------------------------------------------------- |
| **External ID** | Your system identifier (if set). |
| **OneSignal ID** | Unique OneSignal user ID. |
| **Subscription ID** | Unique subscription instance (device + app/browser). |
| **Device** | Browser or OS type. If you see `()`, the device has been deleted. |
| **Impression** | Timestamp when the notification was displayed on the device. |
| **Clicked** | Timestamp if the user clicked, or `-` if not. |
Audience activity data is only available for **30 days** from the time the message is displayed. Export results if you need to retain them longer.
***
### Why audience activity is helpful
Audience activity helps you go beyond delivery counts by showing which specific users fall into each outcome. Use it to:
* **Measure engagement** by comparing clicks vs. non-clicks.
* **Diagnose notification visibility** by confirming impressions.
* **Segment audiences** for retargeting or export.
***
### Exporting results
You can download audience data with the **Export** menu:
* **Selected activity** – exports only the currently viewed tab (for example, all users who did not click).
* **All activities** – exports the full report across every category.
Exports let you analyze results offline, share with other teams, or merge with your CRM and analytics tools.
## FAQ
### Why are there fewer clicks than impressions?
* In-App Messages can be "swiped away" or automatically dismissed after a certain amount of time has passed. See [Advanced Settings](./in-app-messages-setup).
### Why are there more clicks than impressions?
* Multiple blocks can be clicked on the same impression of an In-App Message.
### Why do I see "Deleted" blocks?
* If you add/remove/update a card or block of an In-App Message, it will delete the old blocks and add new ones. The old blocks will be labeled with "Deleted" and keep their current impression and click data.
* For example, a "Deleted body", "Deleted Element" and/or "Deleted close\_button" means a change occurred in the IAMs body/text and close blocks.
***