This page assumes you’ve already set up Live Activities. For canonical metric definitions across every channel, see the Metrics glossary.
Overview
Live Activities analytics help you:- Measure how many Subscriptions receive your updates.
- Track whether users engage with your Live Activities.
- Identify delivery failures and their causes.
- Monitor subscription health over time.
Key metrics
Live Activities record the following metrics. These are the same definitions used in individual message reports, Audience Activity, and Engagement Trends.Message reports
Individual message reports show the delivery breakdown for a single Live Activity send.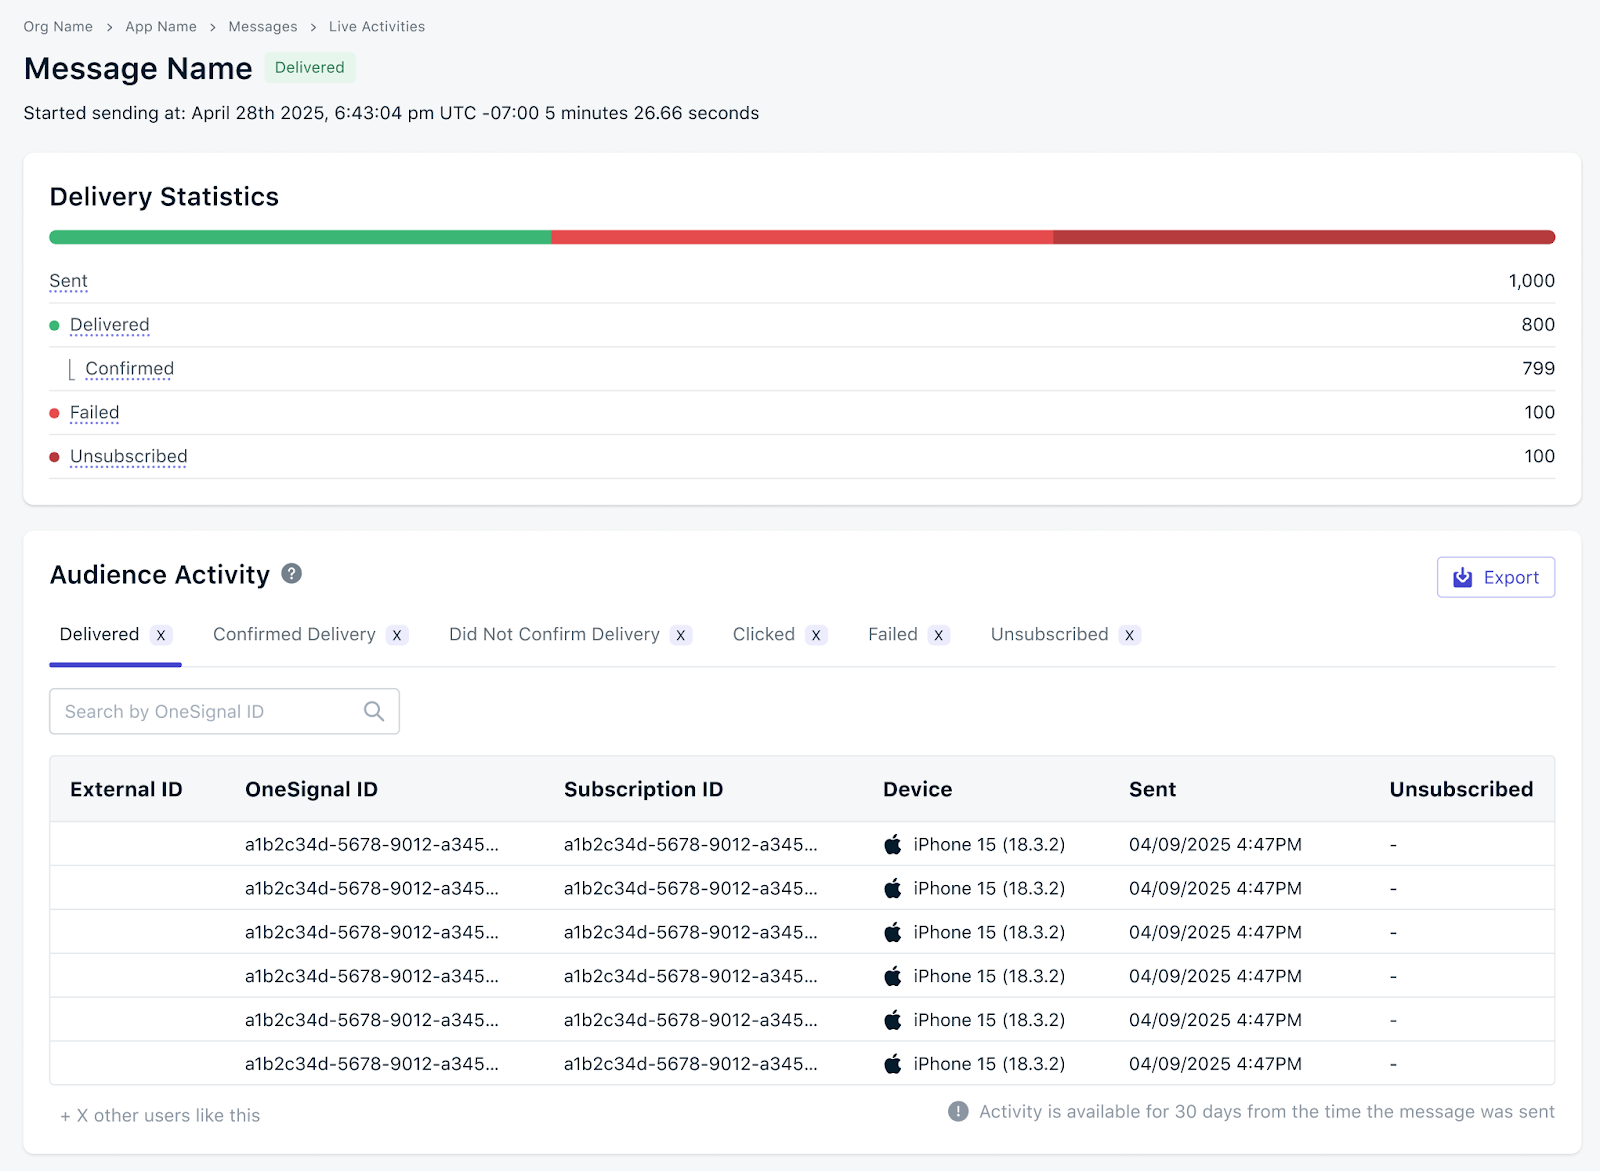
Live Activity Report
1
Open Sent Messages
Go to Sent Messages in your OneSignal dashboard.
2
Filter by Live Activities
Filter the list to show only Live Activity messages.
3
Open the report
Click any Live Activity to view its detailed report.
Audience activity
The Audience Activity panel on a Live Activity message report lists the Subscriptions that contributed to each metric, so you can investigate individual outcomes. To view Audience Activity:1
Open a message report
Open any Live Activity message report from Sent Messages.
2
Locate the Audience Activity panel
Scroll to the Audience Activity panel on the report.
3
Select a statistic type
Choose which Subscriptions to list:
- Deliveries — Subscriptions counted as Delivered (accepted by APNs).
- Clicks — Subscriptions counted as Clicked.
- Failures — Subscriptions counted as Failed.
- Unsubscribes — Subscriptions counted as Unsubscribed.
Export Audience Activity
Click the Export button above the Audience Activity panel to export the data. OneSignal emails the CSV to the email address on your current OneSignal user account. Export options:- Single statistic — Only the currently selected activity type (for example, just Clicks or just Failures).
- All statistics — All Audience Activity data for the message.
Large exports may take several minutes to process. OneSignal sends an email notification when the export is ready.
Compute delivery and engagement rates
Live Activity message reports show raw counts. Derive rates to compare performance across sends or time periods. Confirmed Receipt Rate — the percentage of delivered updates that the device confirmed receiving:Troubleshooting
High Failed rate
- Check update token validity. Live Activity update tokens expire when the activity ends, is dismissed, or the app is uninstalled. OneSignal stops sending to invalidated tokens.
- Verify APNs configuration. Make sure your APNs authentication key or certificate is current in the OneSignal dashboard.
- Review failure reasons on the message report. Individual failures include an error code from APNs.
Low Confirmed Receipt
- Verify iOS SDK version is 5.2.15 or higher.
- Complete the confirmed receipt setup. Confirmed Receipt for push and Live Activities requires the Notification Service Extension and App Group setup in your iOS app.
- Account for device conditions. Devices offline long enough for APNs to drop Live Activity updates will not produce a Confirmed Receipt.
Declining Click-Through Rate
- Review content relevance and timing on the individual message reports where CTR dropped.
- Compare against historical CTR from Engagement Trends to distinguish a one-off dip from a trend.
FAQ
How long is Live Activity data retained?
Individual message reports in Sent Messages are retained for 30 days. Aggregate data in Engagement Trends is retained for up to 2 years depending on your pricing plan.Why is my Confirmed Receipt count lower than Delivered?
Confirmed Receipt requires iOS SDK 5.2.15 or higher and completed Confirmed receipt setup. Subscriptions on older SDK versions, devices that were offline long enough for APNs to drop queued updates, and users who disabled Live Activities all reduce Confirmed Receipt relative to Delivered.Why is Unsubscribed counted when a user dismisses the activity?
Once a user dismisses a Live Activity or disables Live Activities in device settings, APNs reports the activity token as invalid. OneSignal counts these Subscriptions as unsubscribed for Live Activity updates and stops sending further updates.Can I track individual user journeys?
Yes. Use the Audience Activity panel on a message report to list the Subscriptions behind each metric, then export the CSV for deeper analysis or join against your own data warehouse.Can I stream Live Activity events to my own analytics stack?
Yes. Use Event Streams to forwardmessage.live_activity.* events (sent, delivered, failed, unsubscribed, clicked) to your warehouse in real time. See the Metrics glossary for the full event name mapping.
Related
Live Activities setup
Set up Live Activities with the OneSignal iOS SDK.
Confirmed receipt
Platform requirements and SDK setup for the Confirmed Receipt metric.
Engagement trends
Aggregate delivery and engagement trends across all channels, including Live Activities.
Metrics glossary
Canonical definitions for every metric across the dashboard, API, CSV, and Event Streams.