Learn how to capture detailed debug logs from your mobile app using the OneSignal SDK. This guide walks through enabling verbose logging, reproducing issues, and sharing logs for troubleshooting push notification issues across Android and iOS platforms.
Capturing a debug log is the most effective way to troubleshoot mobile SDK and push notification issues. This guide will help you generate debug logs for your iOS and Android app and share logs with our Support Team if needed.
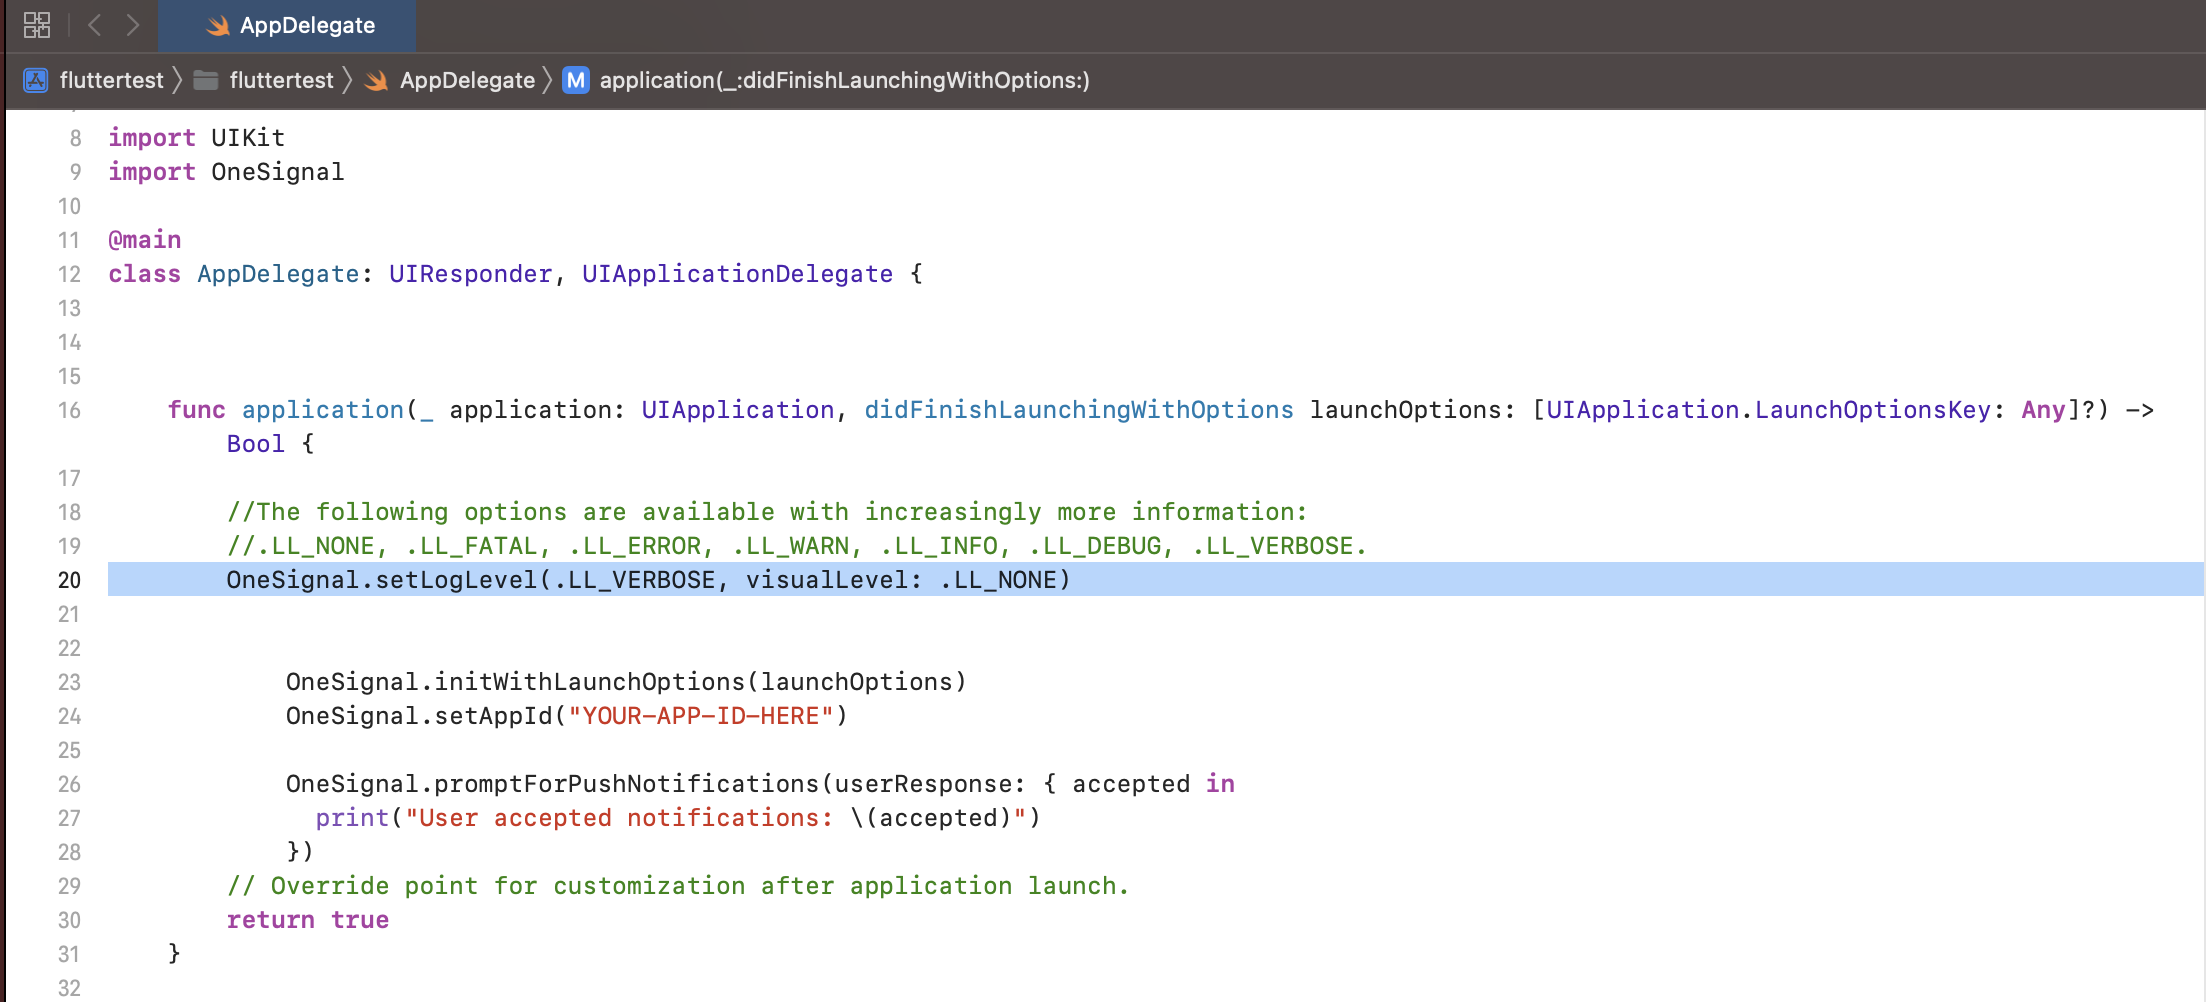
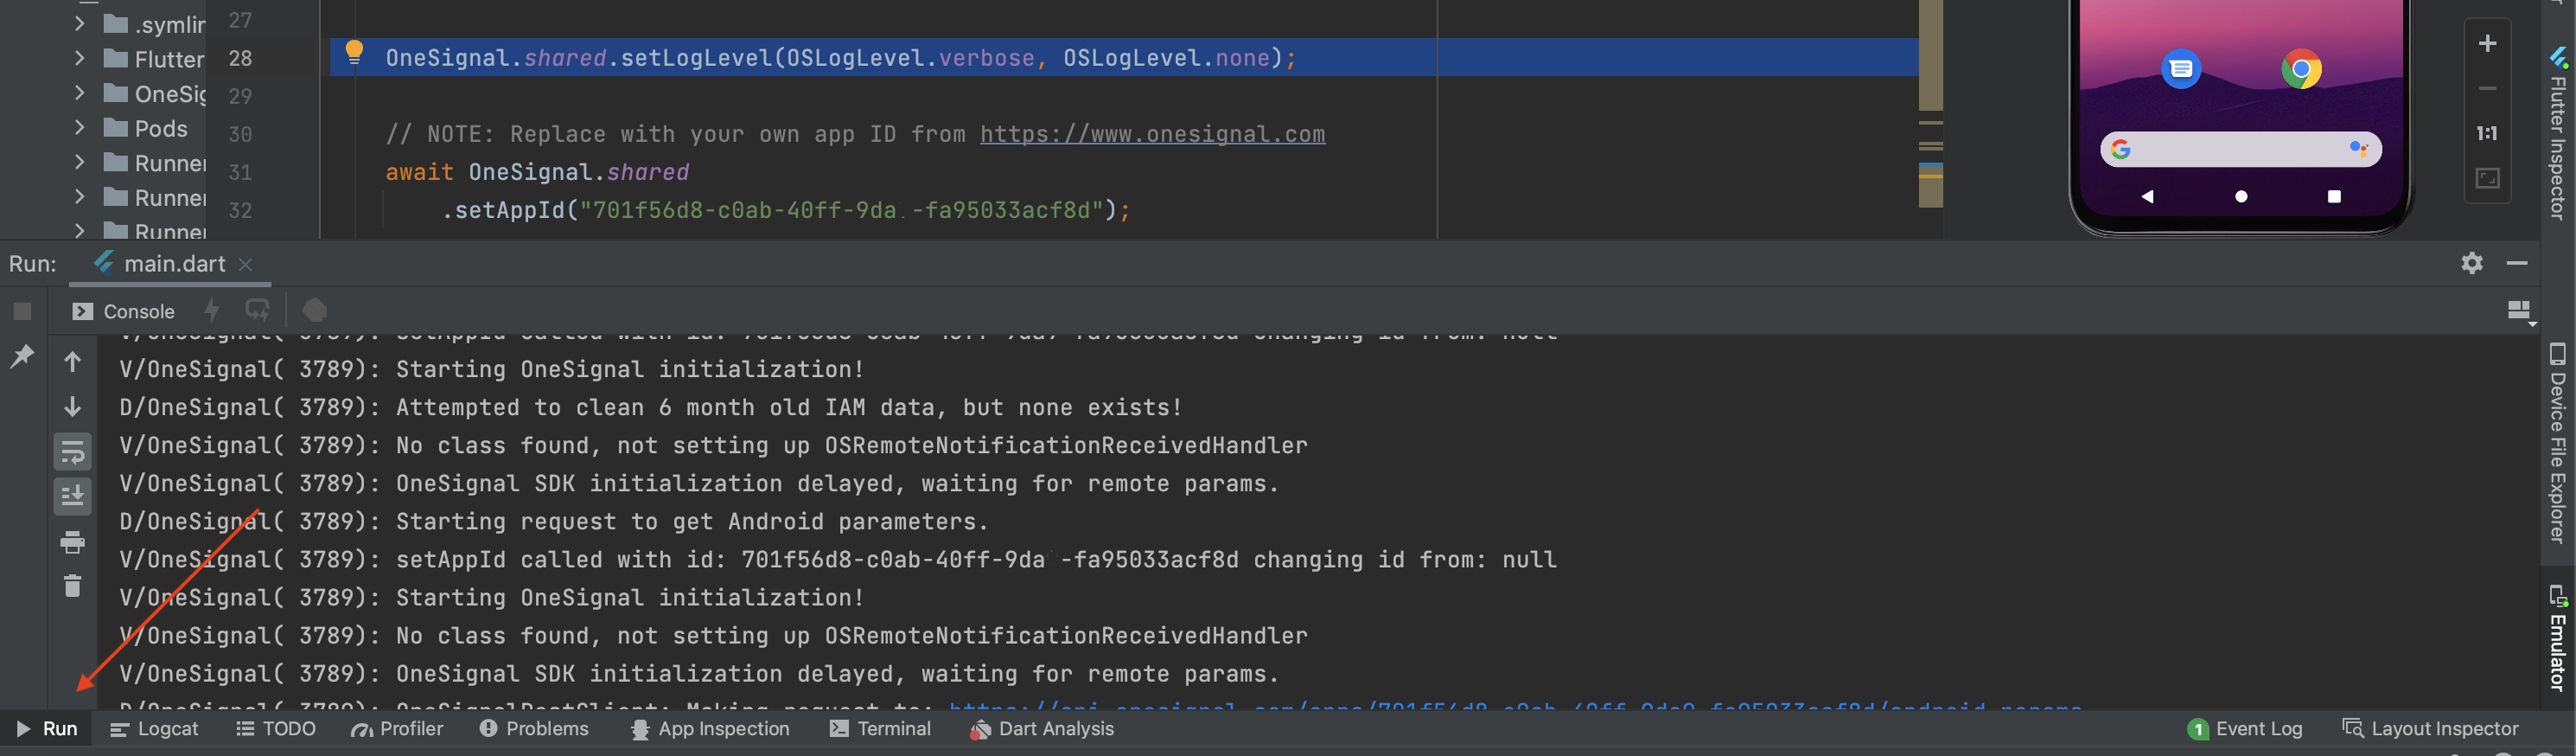
Add the VERBOSE log level call to your app before initializing the OneSignal SDK. This ensures detailed diagnostic information is captured for every OneSignal operation.
Once the issue is reproduced, review the logs to see if it helps diagnose the issue.If you need assistance, copy-paste the entire log from start to end and send them to OneSignal Support as a .txt file.Include all relevant reproduction steps, screenshots, and other details.
If your app encounters issues while running in the background, or if you cannot attach a debugger, you can enable offline logging to capture logs directly on the device.To enable offline logging, add the following code before initializing the OneSignal SDK
import Darwinimport os.Log// ... rest of importsextension OSLog { private static var subsystem = Bundle.main.bundleIdentifier! static let test = OSLog(subsystem: subsystem, category: "Test")}class AppDelegate: UIResponder, UIApplicationDelegate { func application(_ application: UIApplication, didFinishLaunchingWithOptions launchOptions: [UIApplication.LaunchOptionsKey: Any]? = nil) -> Bool { /* LOGGING REDIRECT */ if true { // if no terminal is attached to stderr let documentsUrl = FileManager.default.urls(for: .documentDirectory, in: .userDomainMask).first! let logfileUrl = documentsUrl.appendingPathComponent("out.log") logfileUrl.withUnsafeFileSystemRepresentation { path in guard let path = path else { return } print("redirect stderr and stderr to: \(String(cString: path))") let file = fopen(path, "a") assert(file != nil, String(cString: strerror(errno))) let fd = fileno(file) assert(fd >= 0, String(cString: strerror(errno))) let result1 = dup2(fd, STDERR_FILENO) assert(result1 >= 0, String(cString: strerror(errno))) let result2 = dup2(fd, STDOUT_FILENO) assert(result2 >= 0, String(cString: strerror(errno))) os_log("* os_log: Test", log: OSLog.test, type: .debug) print("* print: Test") NSLog("* NSLog: Test") } } // ... OneSignal initialization and any existing code /* LOGGING CALL */ os_log("os_log: Test", log: OSLog.test, type: .debug) print("print: Test") NSLog("NSLog: Test") return true }}
1
Run the app on the device with the new code added, ideally just before reproducing the issue to reduce the amount of logged output
2
Plug the device into your computer and open Xcode.
3
Navigate to “Window → Devices and Simulators” and click on the name of the app you added the logging to.
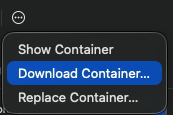
4
Click the settings icon and select “Download Container”.
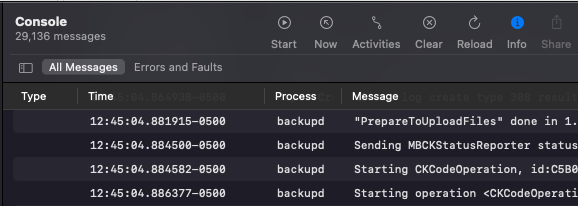
You should now have access to the folder where you’ve chosen to download it, and inside of the /Documents folder, you’ll see the “out.log” file containing the logs captured while offline.