Overview
This guide walks you through troubleshooting your OneSignal Web SDK setup. Before continuing, review the Web SDK setup to ensure you’ve completed all steps. The most common reasons web push appears to not be working are related to your browser and device’s notification settings:Browser compatibility
Users may see web permission prompts but cannot subscribe to push notifications in incognito, private, or guest browser modes.Browser compatibility by operating system
Browser compatibility by operating system
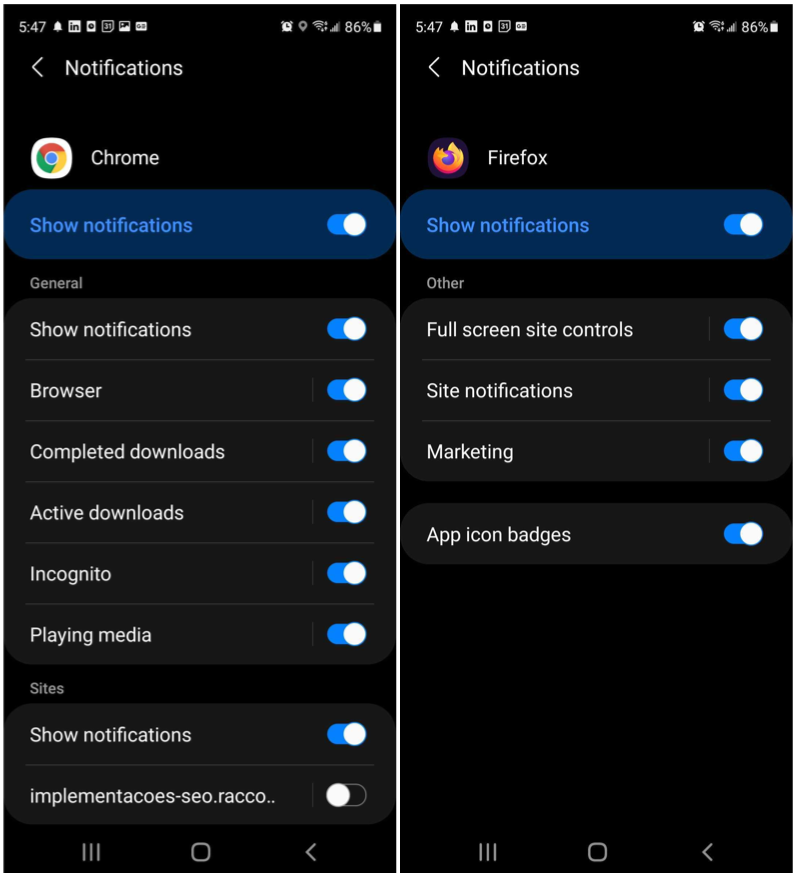
Device notification settings
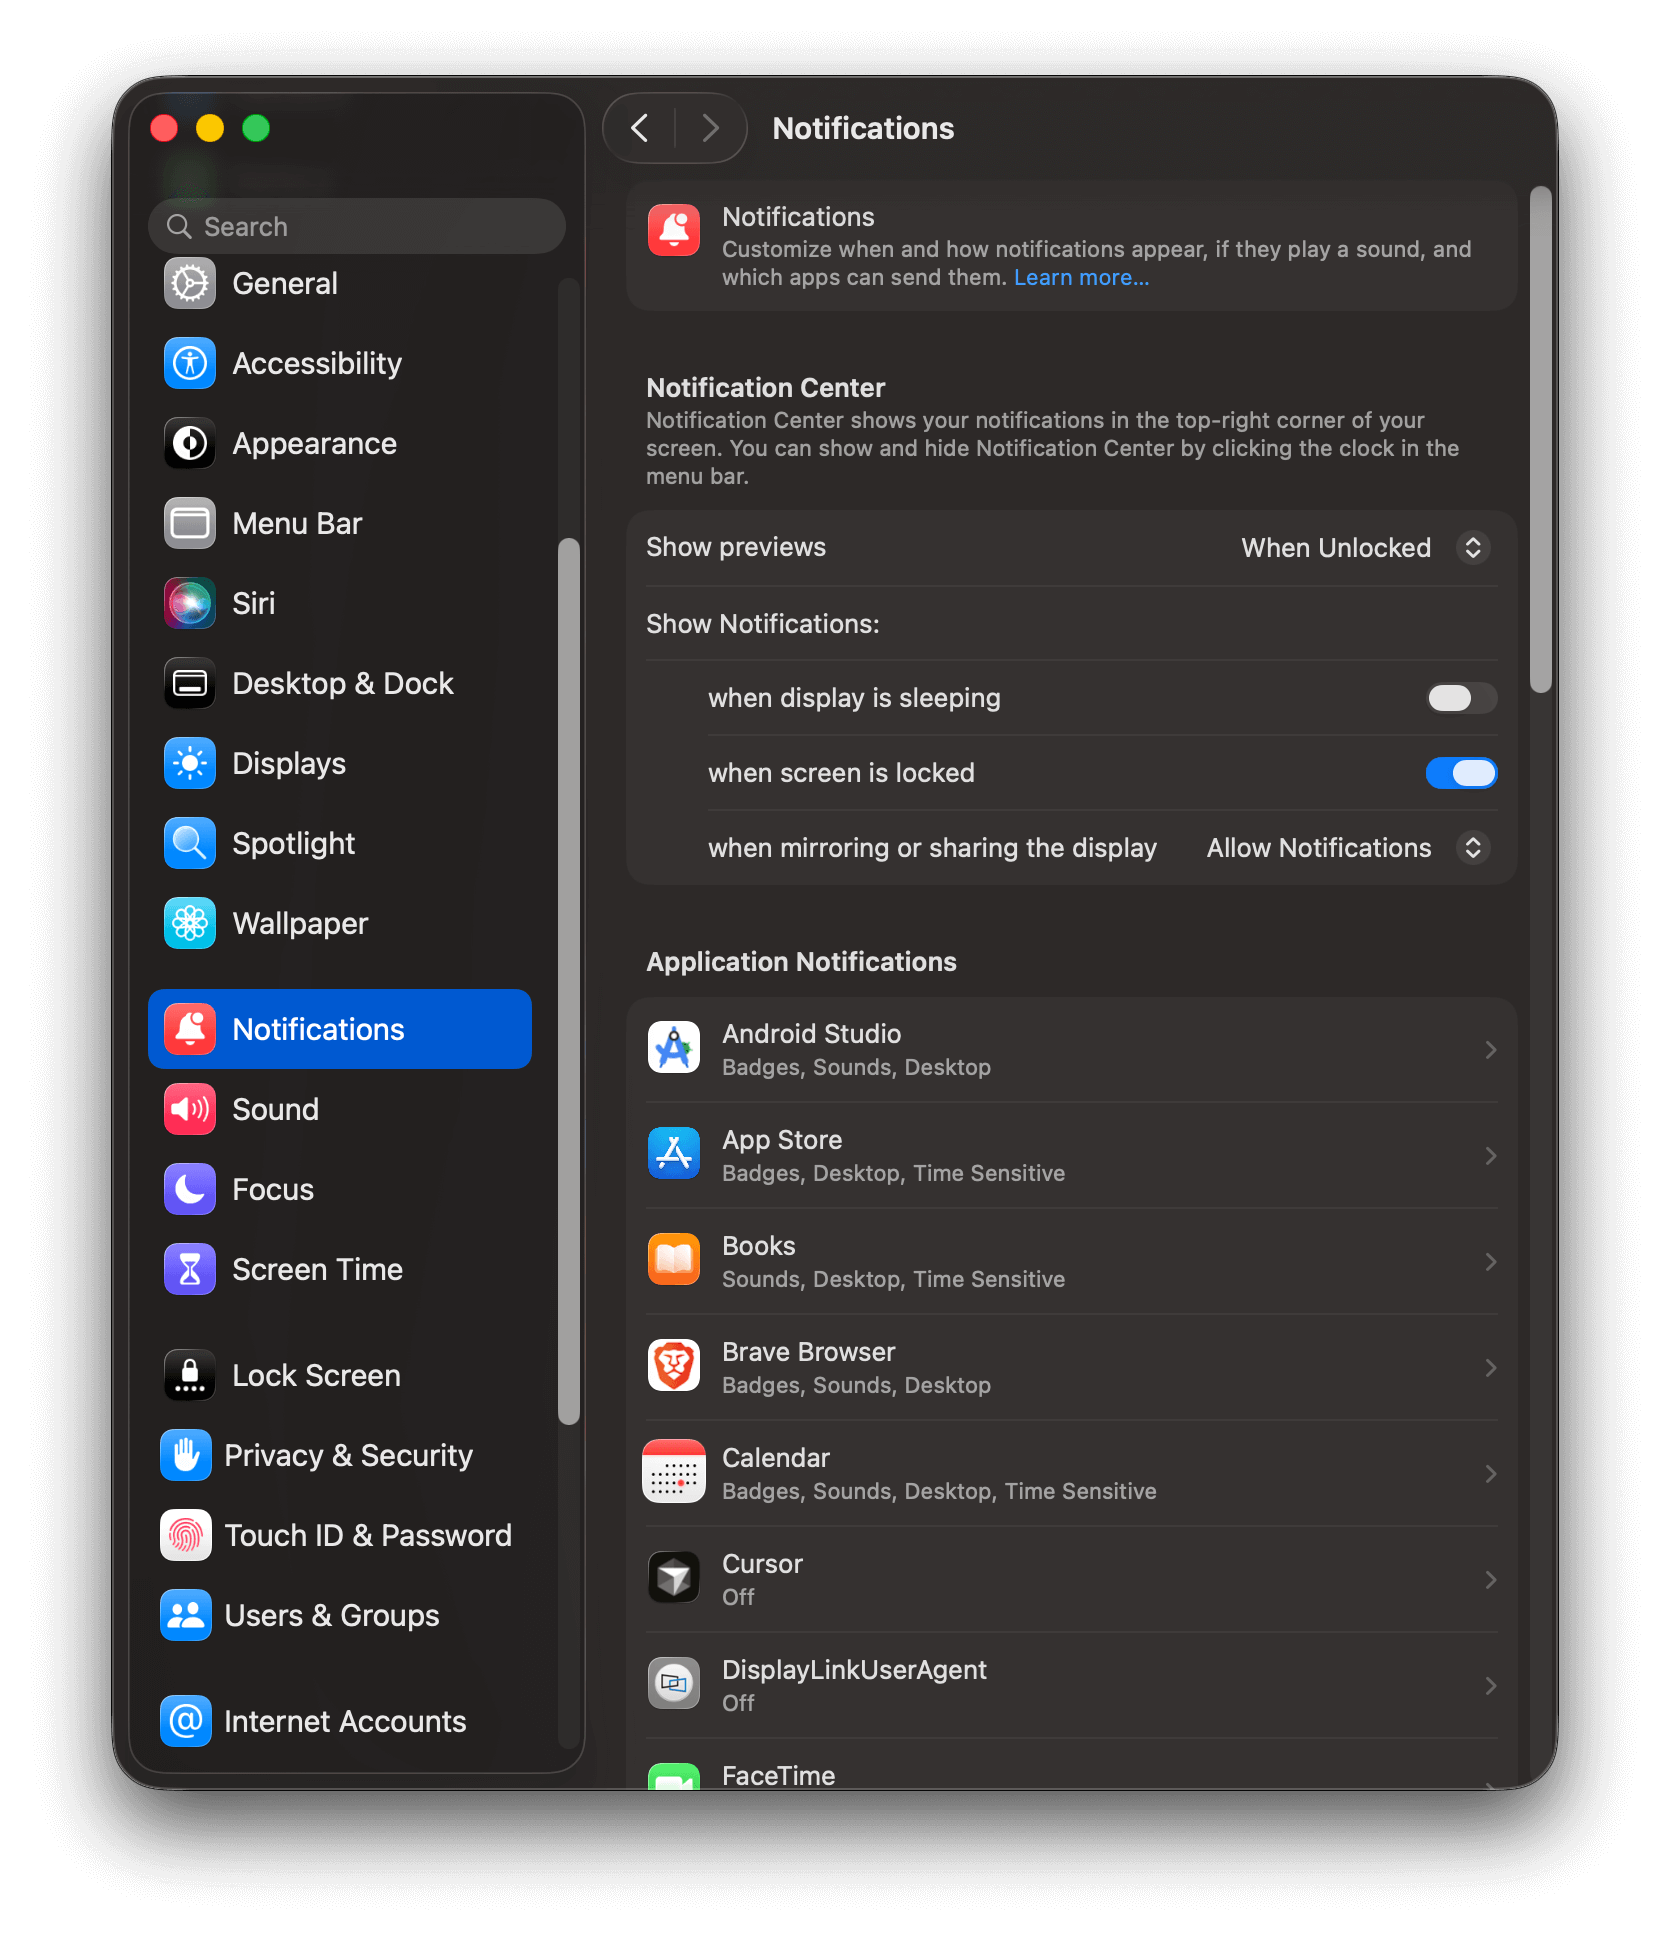
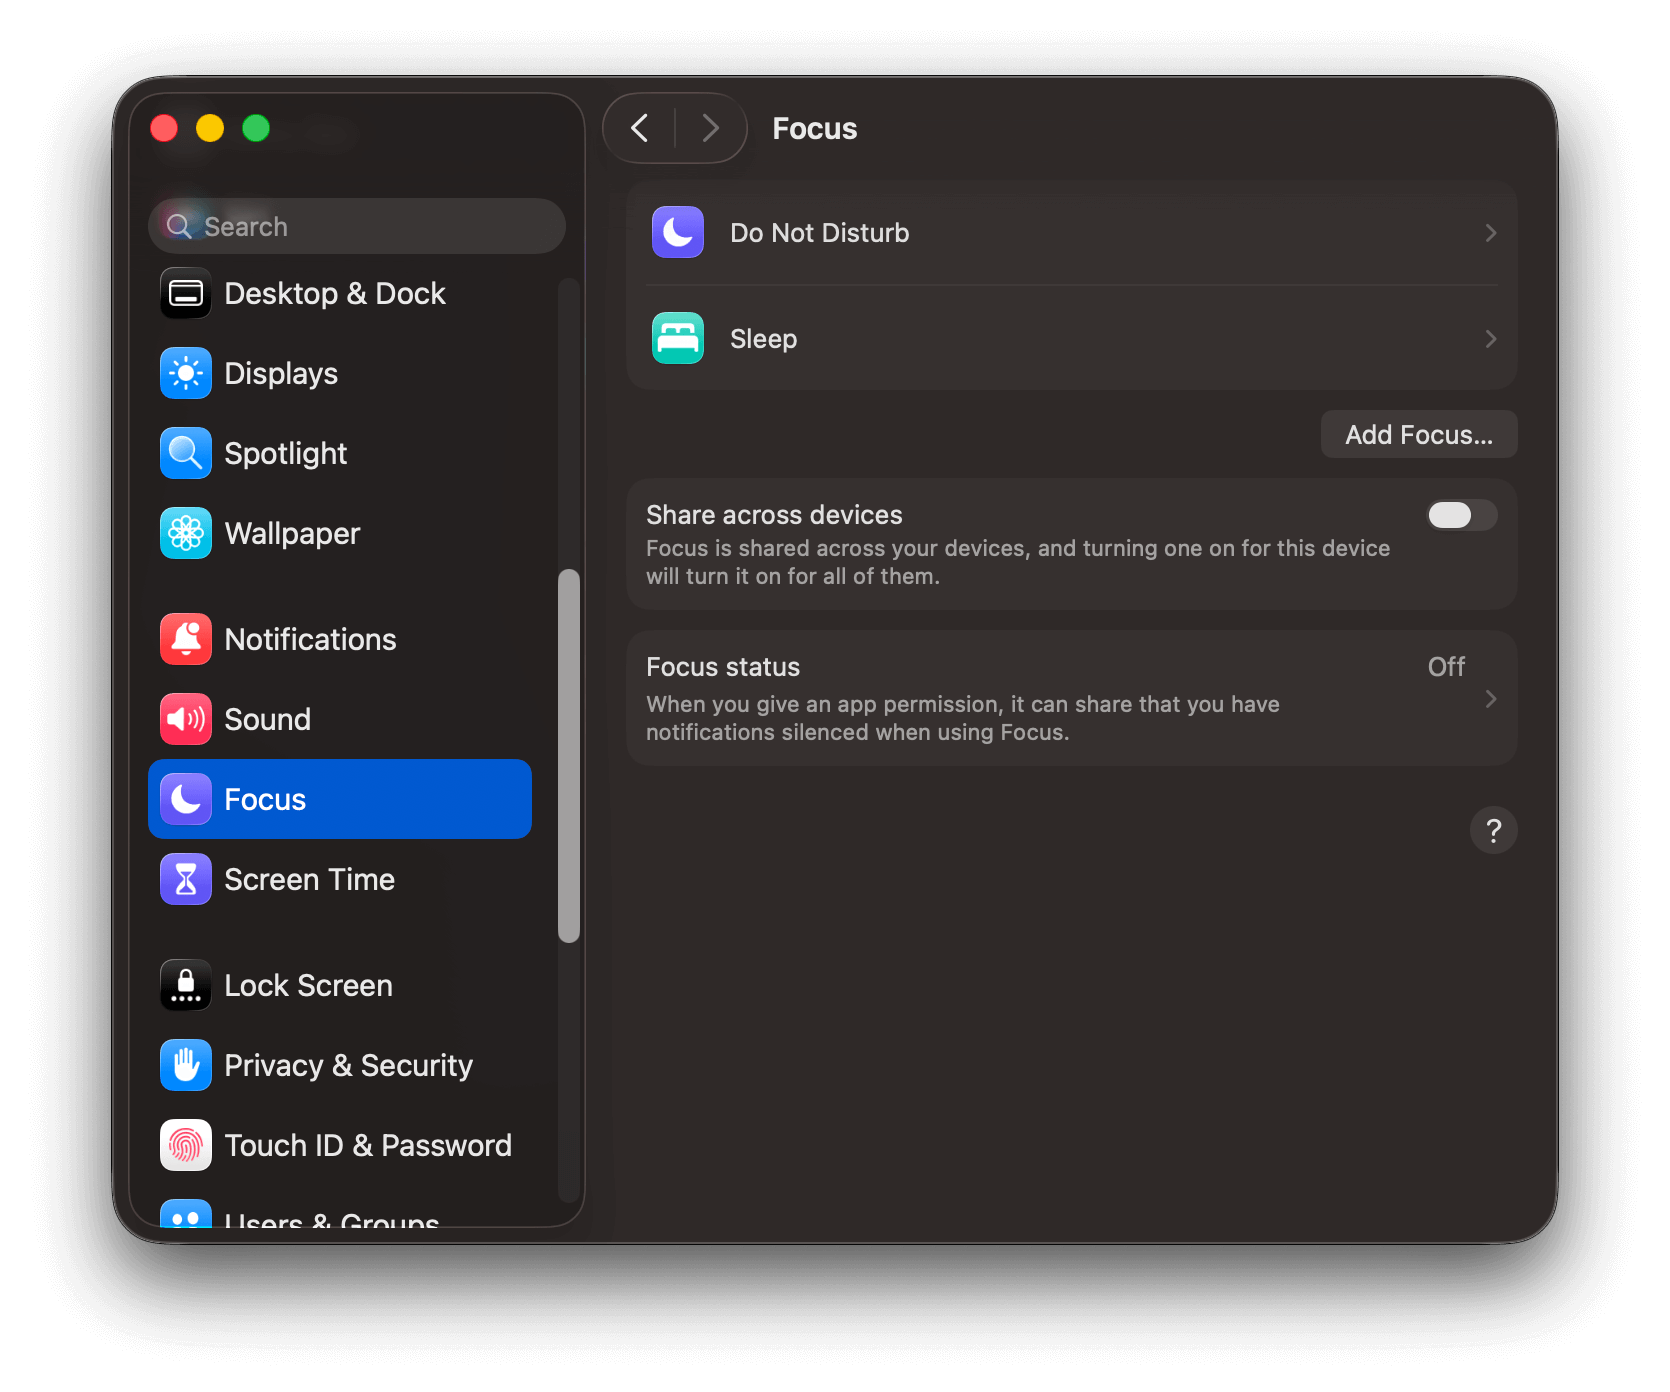
Device Notification Settings are the most common cause of web push not appearing on a device. Check the following settings including Focus modes (Do Not Disturb, Low Battery, etc.) before looking elsewhere.- Windows
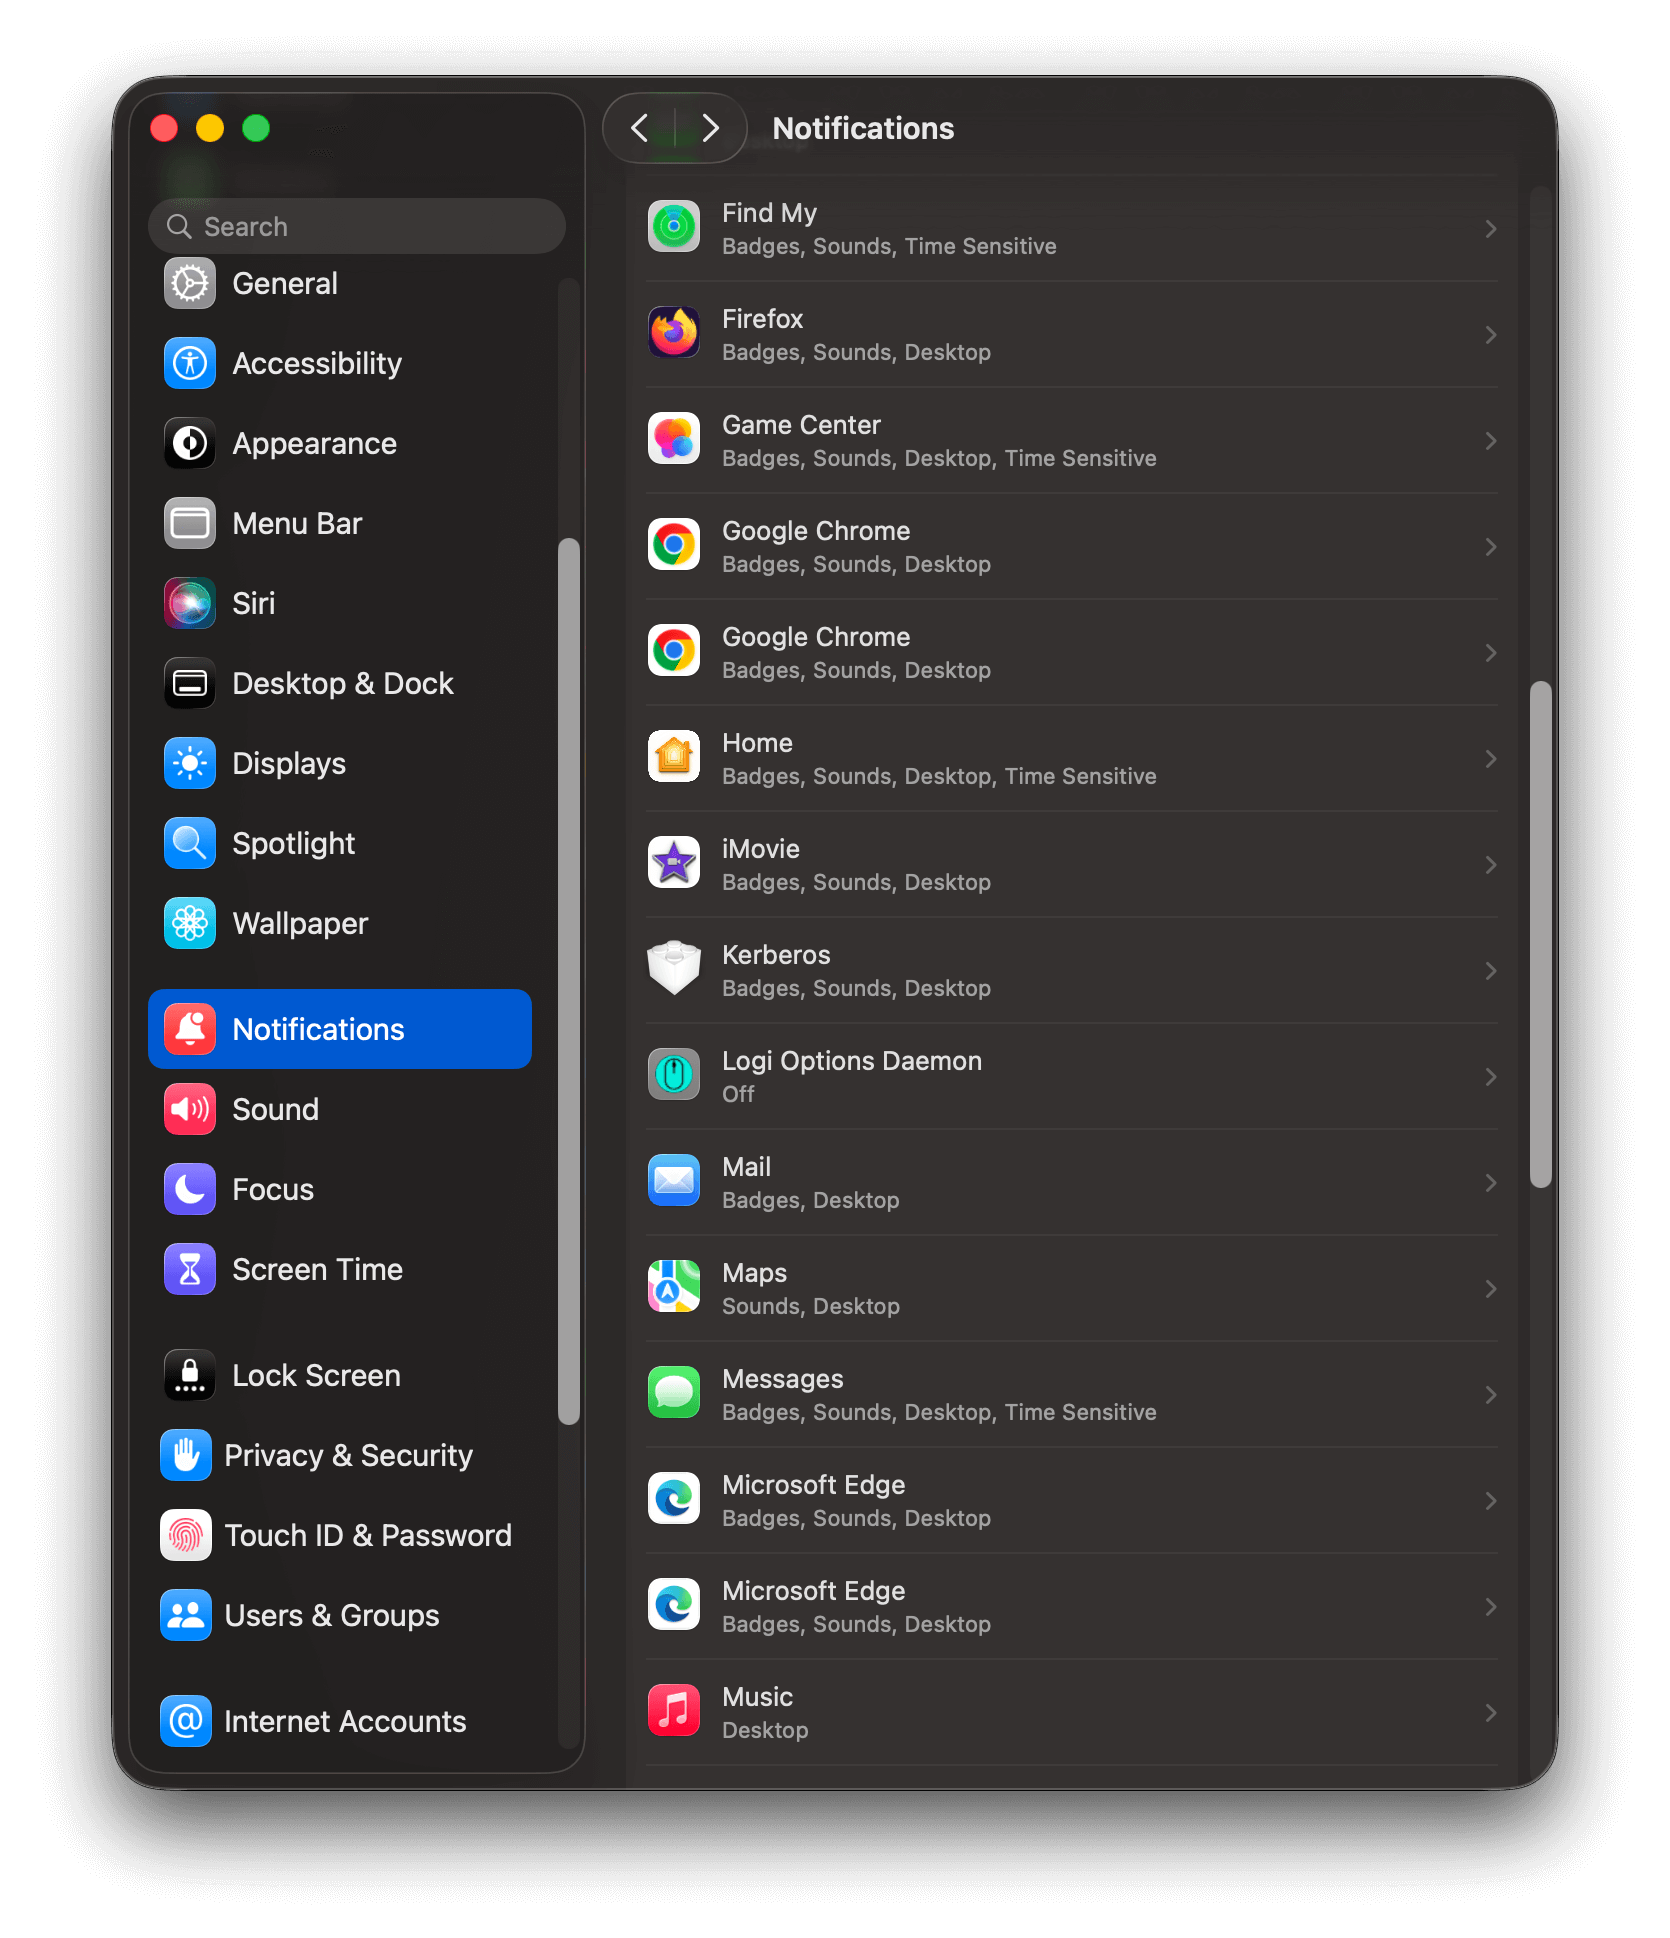
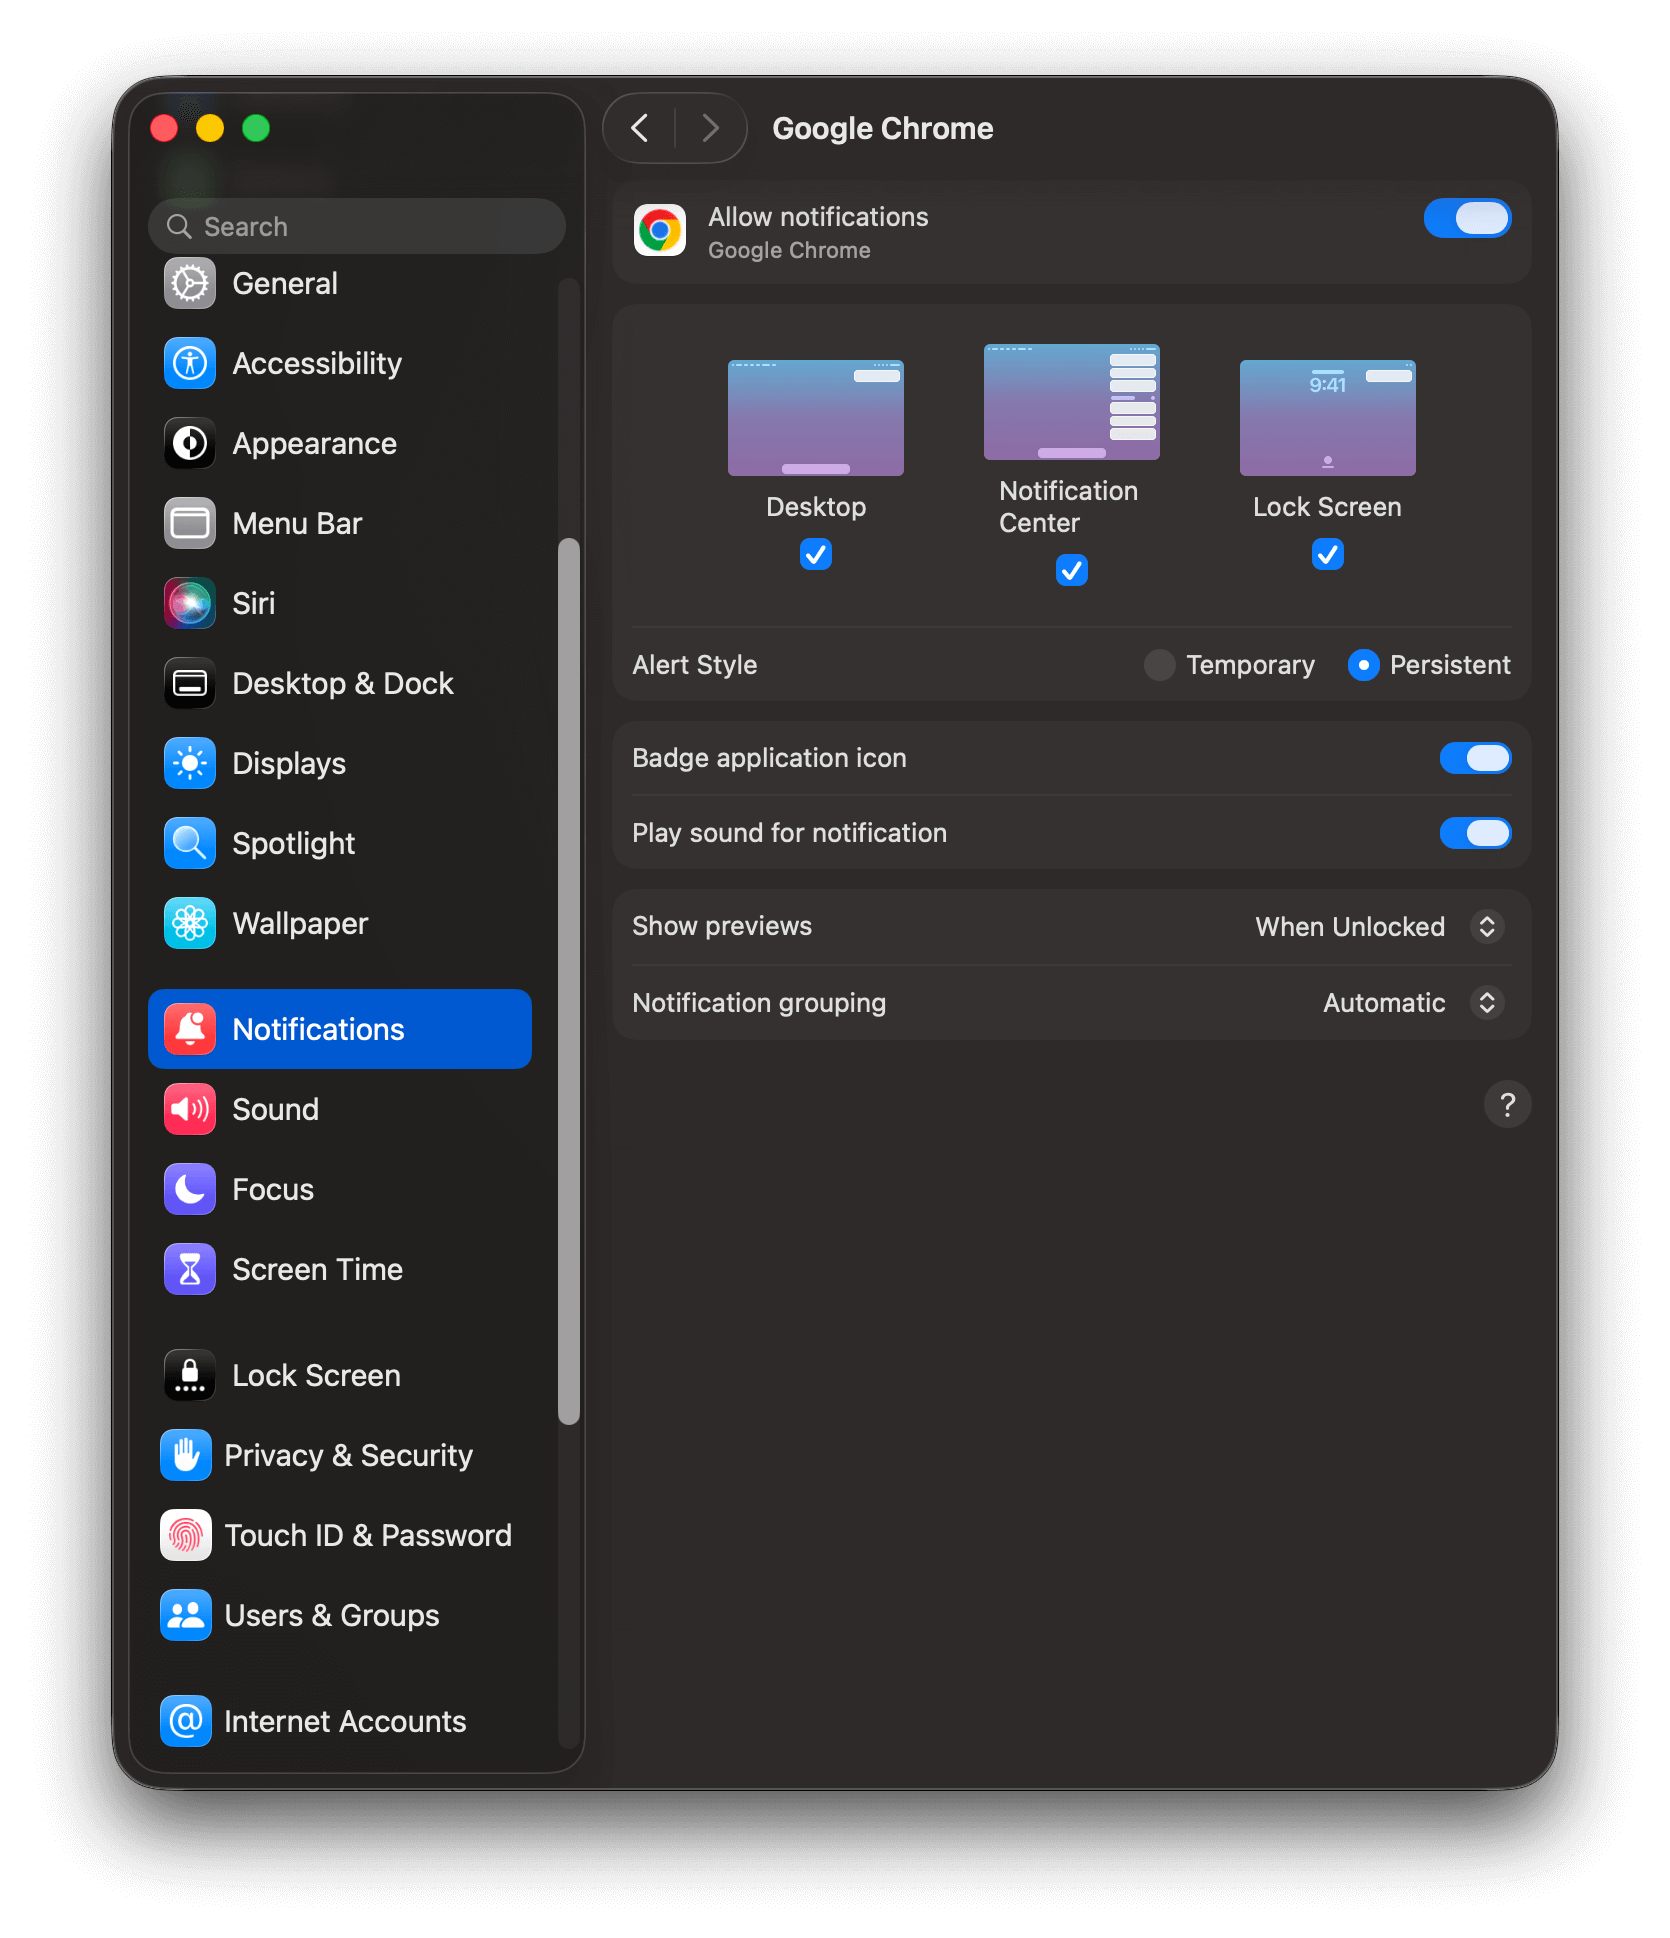
- macOS
- Android
- iOS
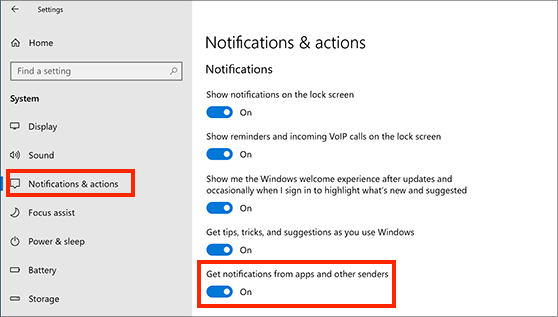
Windows 10 Notification Settings
Windows 10 Notification Settings
- Select Start > Settings > Notifications & Actions > Get notifications from apps and other senders
- Make sure your site and browser are also enabled.
Windows 10 Notification Settings
- Select Start > Settings > System > Notifications
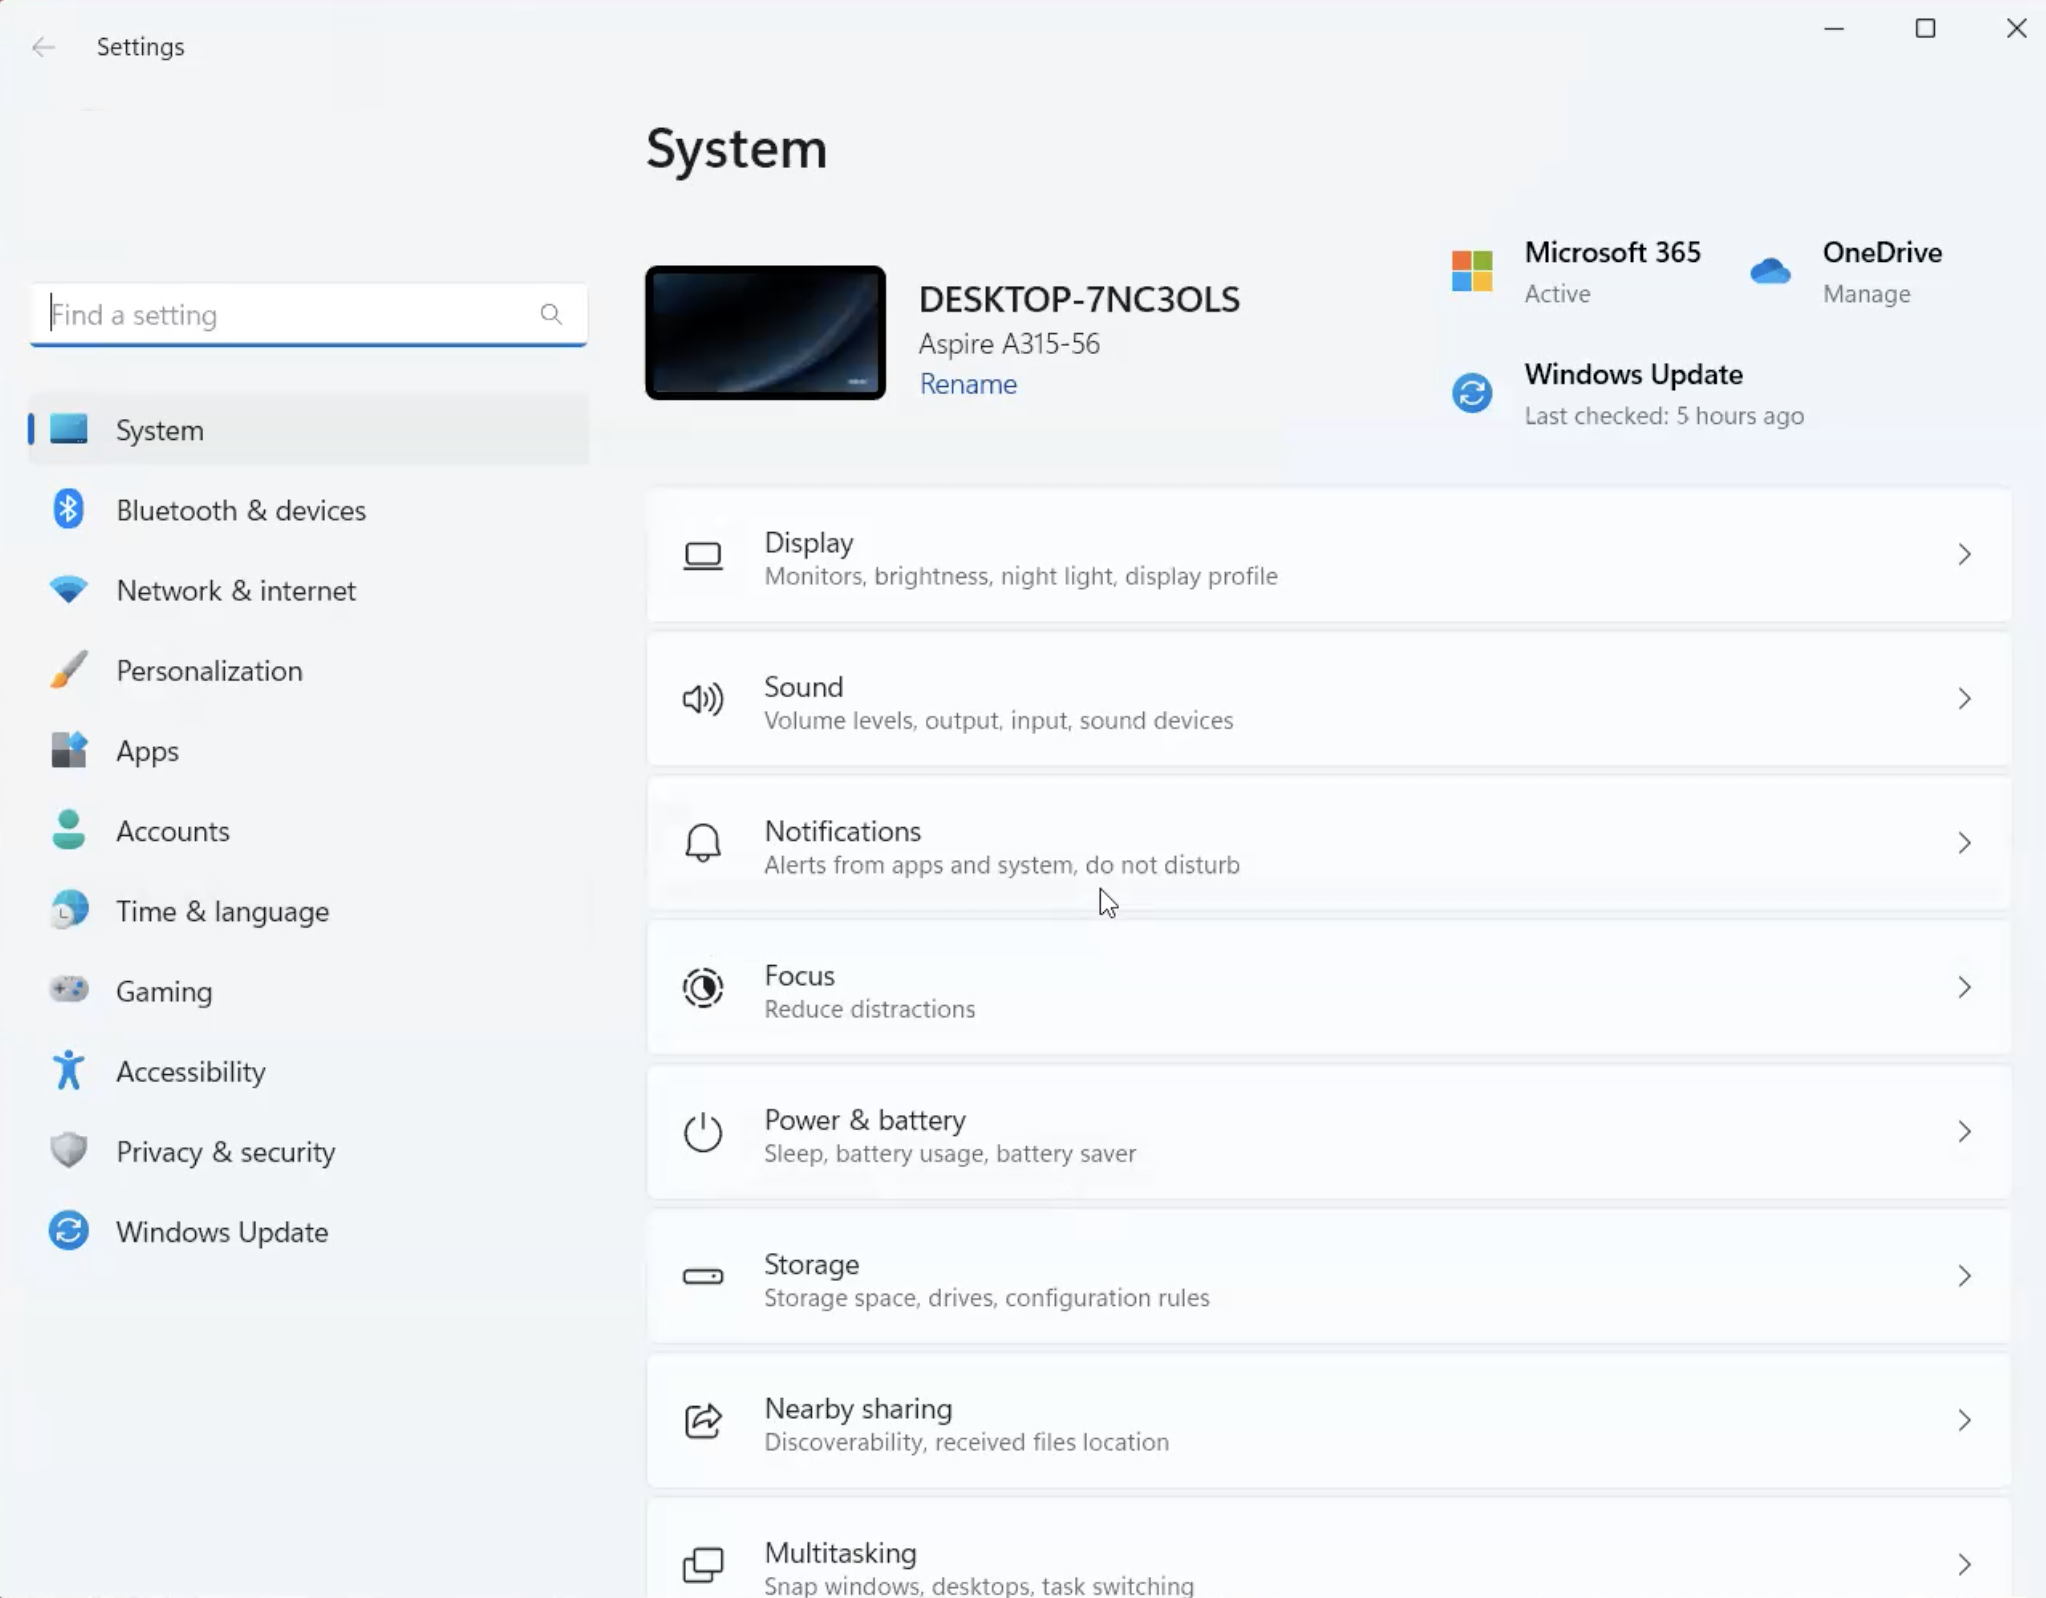
Windows 11 Notification Settings
- Turn On Notifications
- Turn Off Do not disturb (while testing, push will show when this is disabled)
- Scroll down to Notifications from apps and other senders
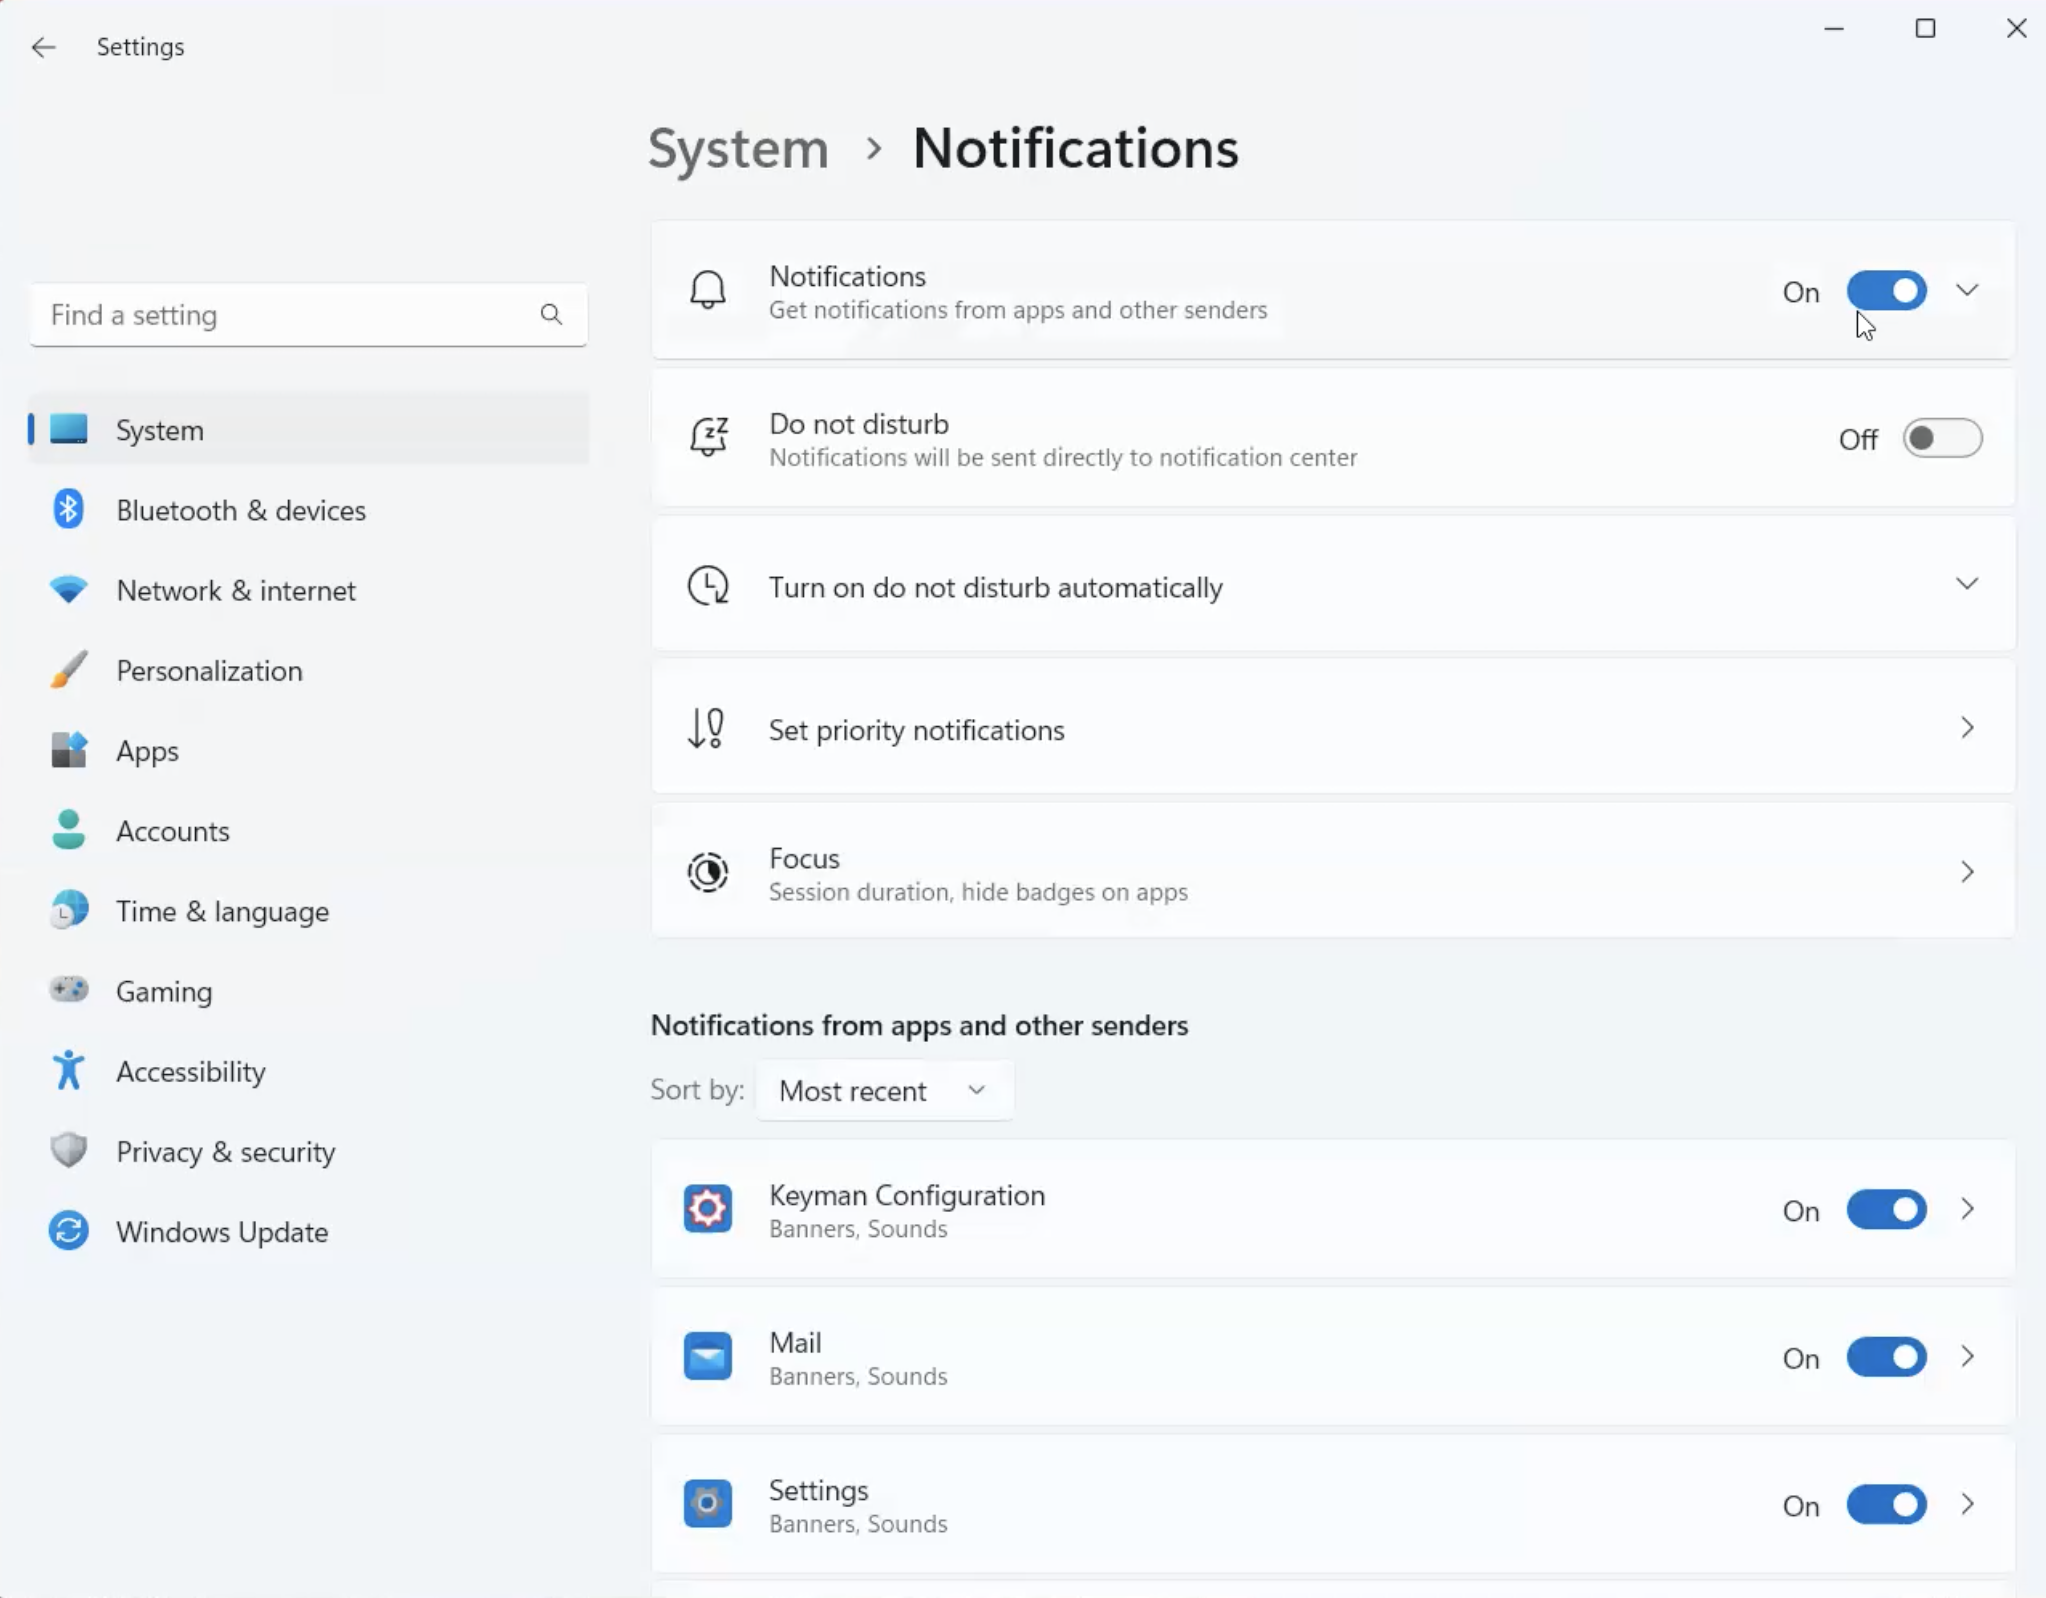
Windows 11 Notifications from apps and other senders
- Make sure your browsers are turned On.
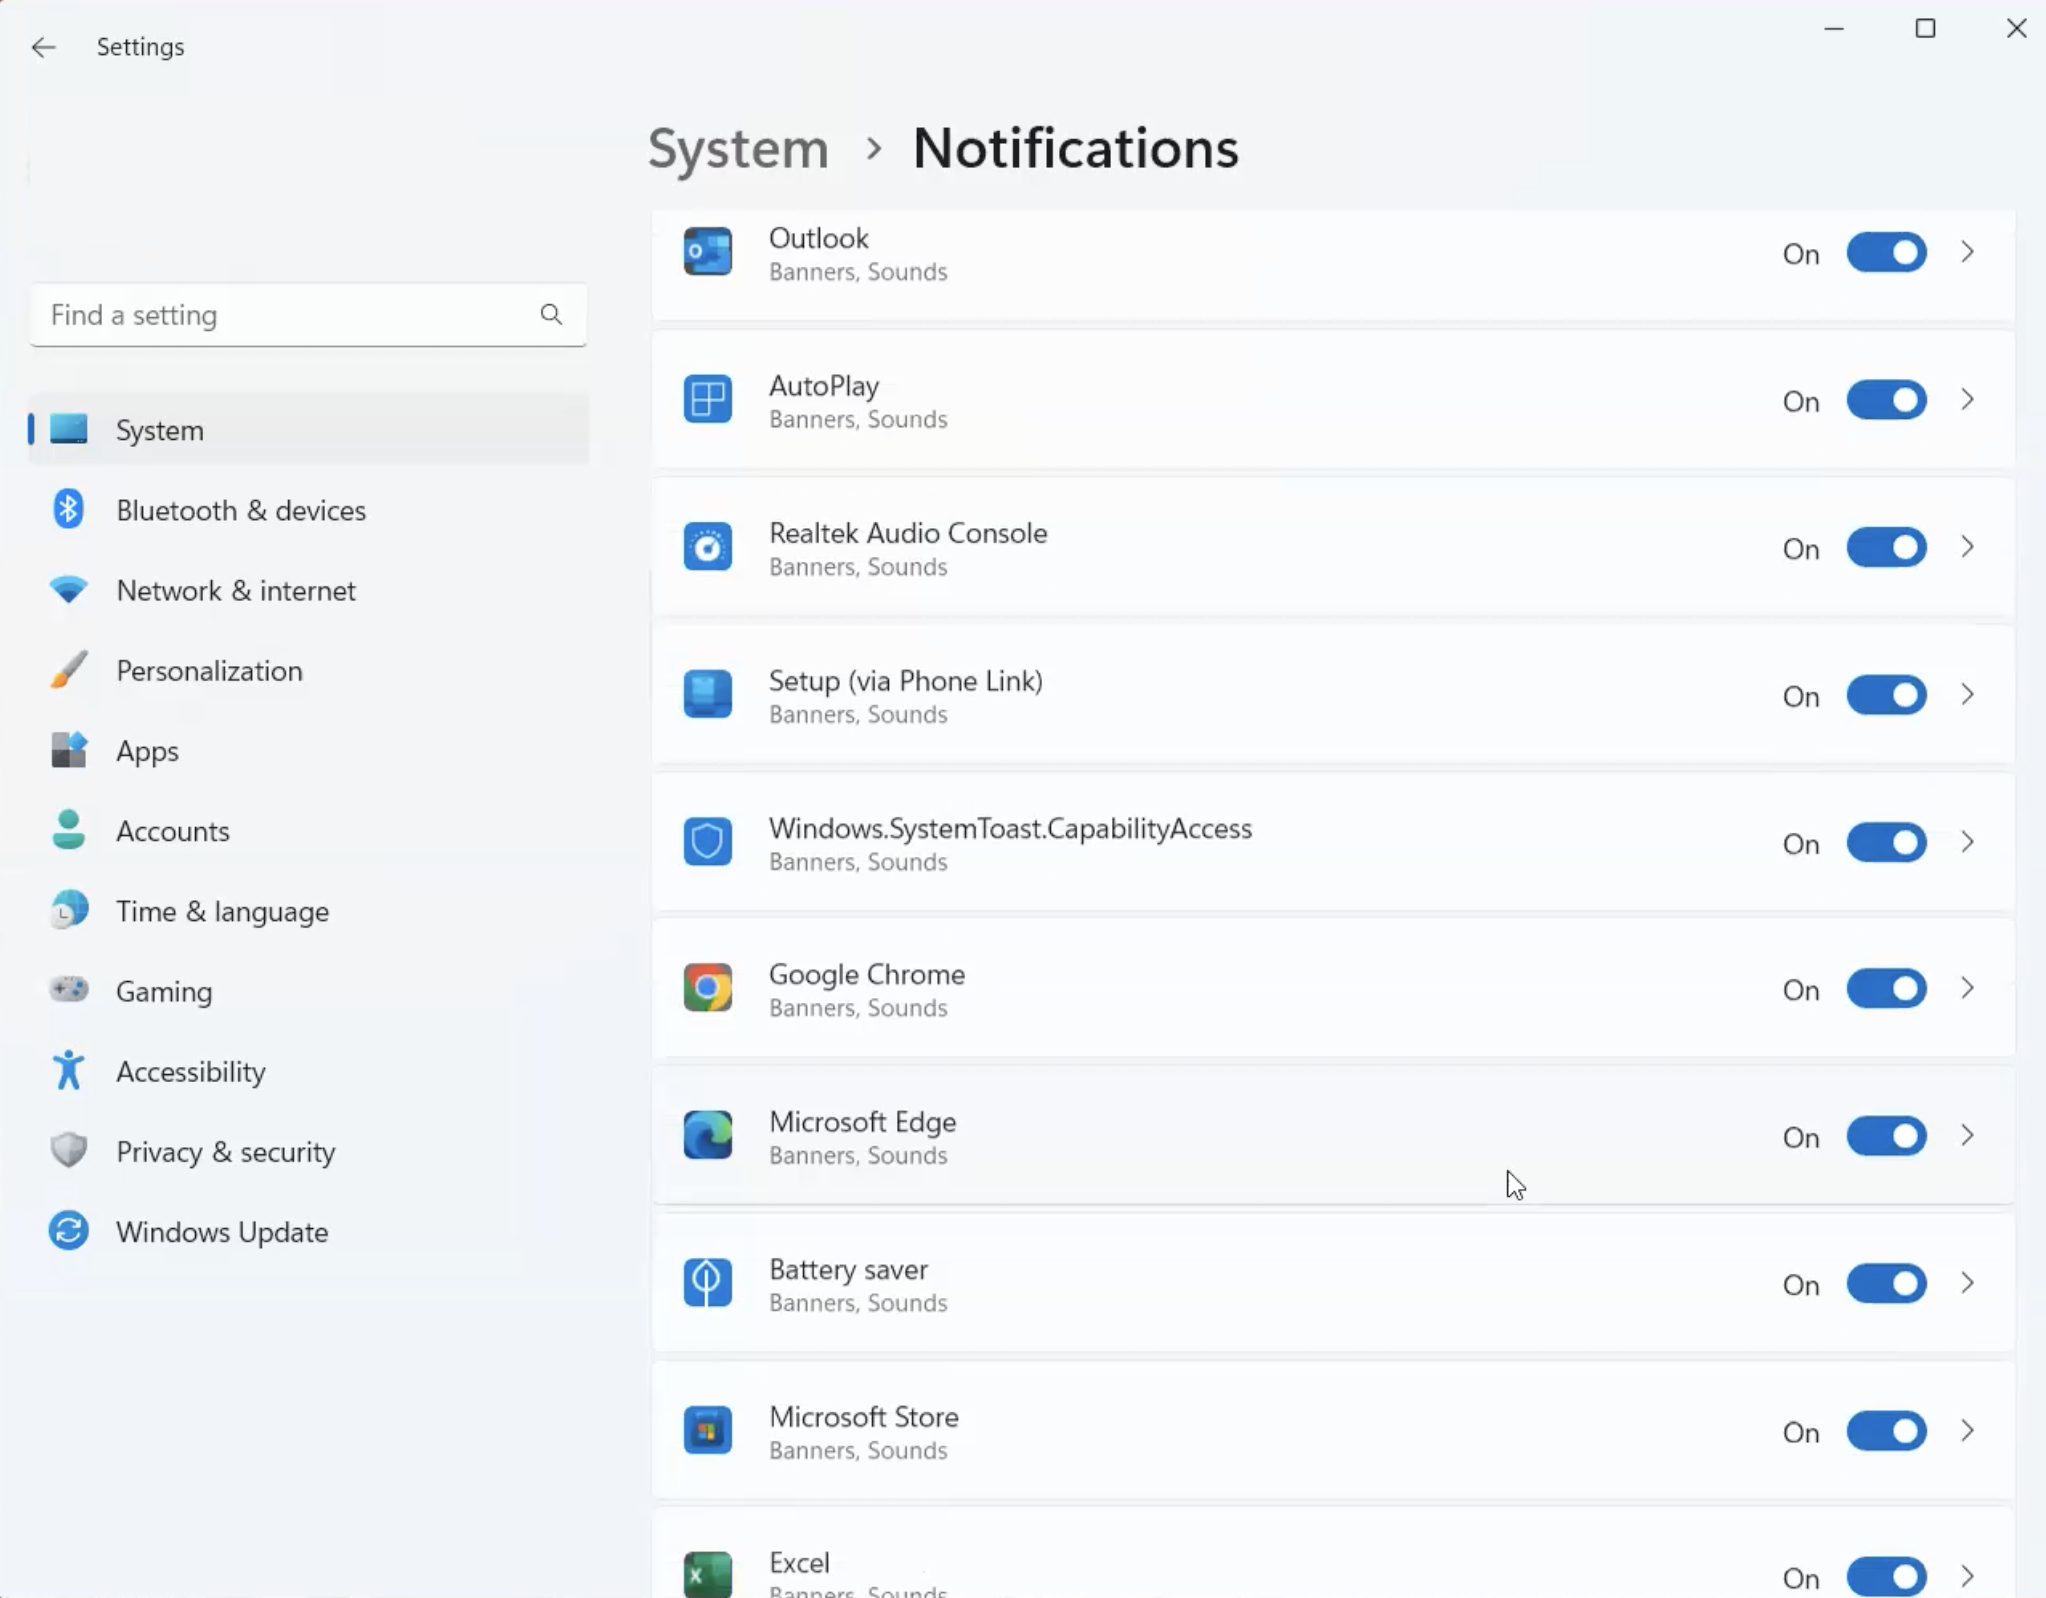
Windows 11 Notification Settings Browser List
Prompt display issues
The following are common reasons why the web push notification prompt may not display as expected.Confirm a prompt is configured
Check browser compatability, incognito, private browser, or guest browser modes.
Check your browser's Notification Settings
chrome://settings/content/notifications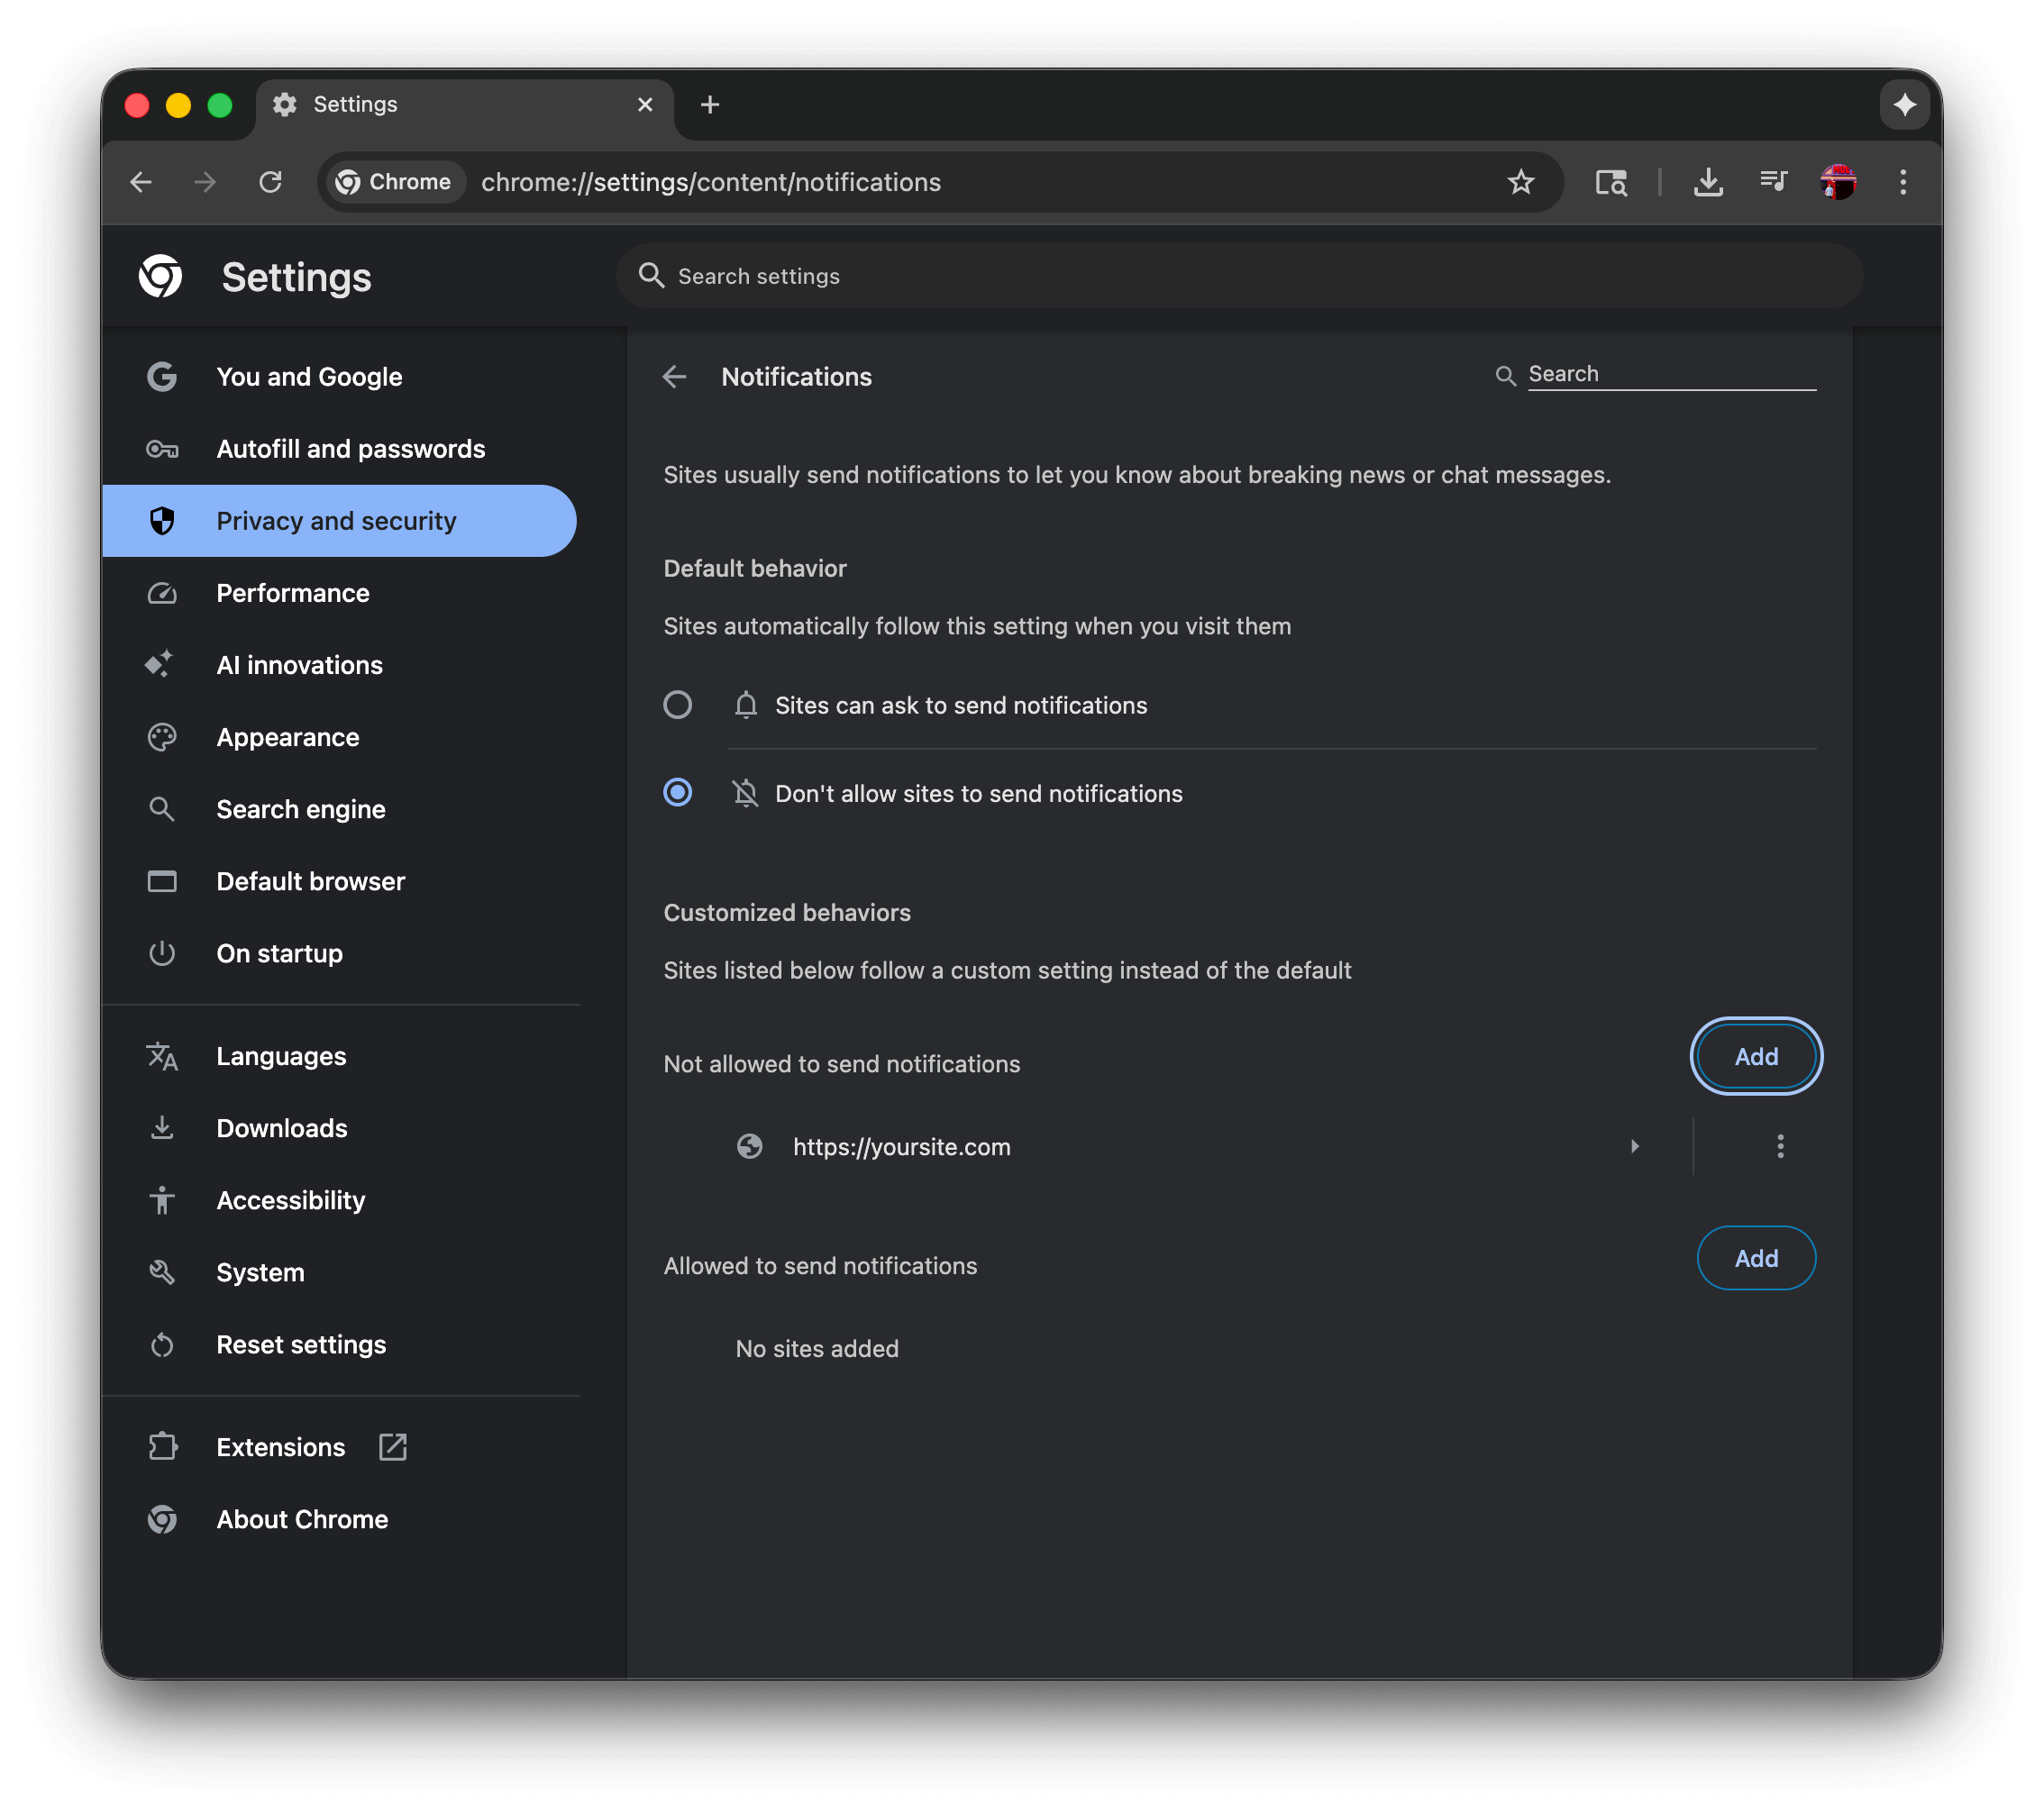
Chrome Notifications settings
- The user has selected “Don’t allow sites to send notifications” which will prevent the native permission prompt from showing. This must show “Sites can ask to send notifications” to allow the native permission prompt to show.
- The user has added
https://yoursite.comto the “Not allowed to send notifications” list, which will prevent the native permission prompt from showing. This must be removed from the list to allow the native permission prompt to show.
- Chrome - This page explains how to manage notifications in Chrome by going to Settings > Privacy and security > Site Settings > Notifications, where you can control default behavior and manage permissions for individual websites.
- Firefox - This guide covers Firefox’s Web Push notifications, explaining how to manage notification permissions through Settings > Privacy & Security > Notifications, and how to control permissions for specific sites through the address bar’s site information icon.
- Safari - This Apple guide explains how to customize Safari notifications on Mac through Safari > Preferences > Websites > Notifications, where you can manage which sites can send notifications and control notification behavior through System Preferences.
- Edge - This article details how to manage Edge notifications by navigating to Settings > Privacy, search, and services > Site permissions > Notifications, or by clicking the site information icon in the address bar.
iOS/iPadOS requirements are not met.
Troubleshooting steps
After checking the above, follow these steps to troubleshoot your OneSignal Web SDK setup.Open the browser developer tools console
- Desktop
- Android
- iOS
- Chrome: Right click on the page, click Inspect, and click the Console tab of the popup window that opens up.
- Firefox: Right click on the page, click Inspect element, and click the Console tab of the popup window that opens up.
- Safari: Go to Safari → Preferences → Advanced and make sure Show Develop menu in menu bar is checked. Then, on your webpage, right click, click Inspect element, and click the Console tab of the popup window that opens up.
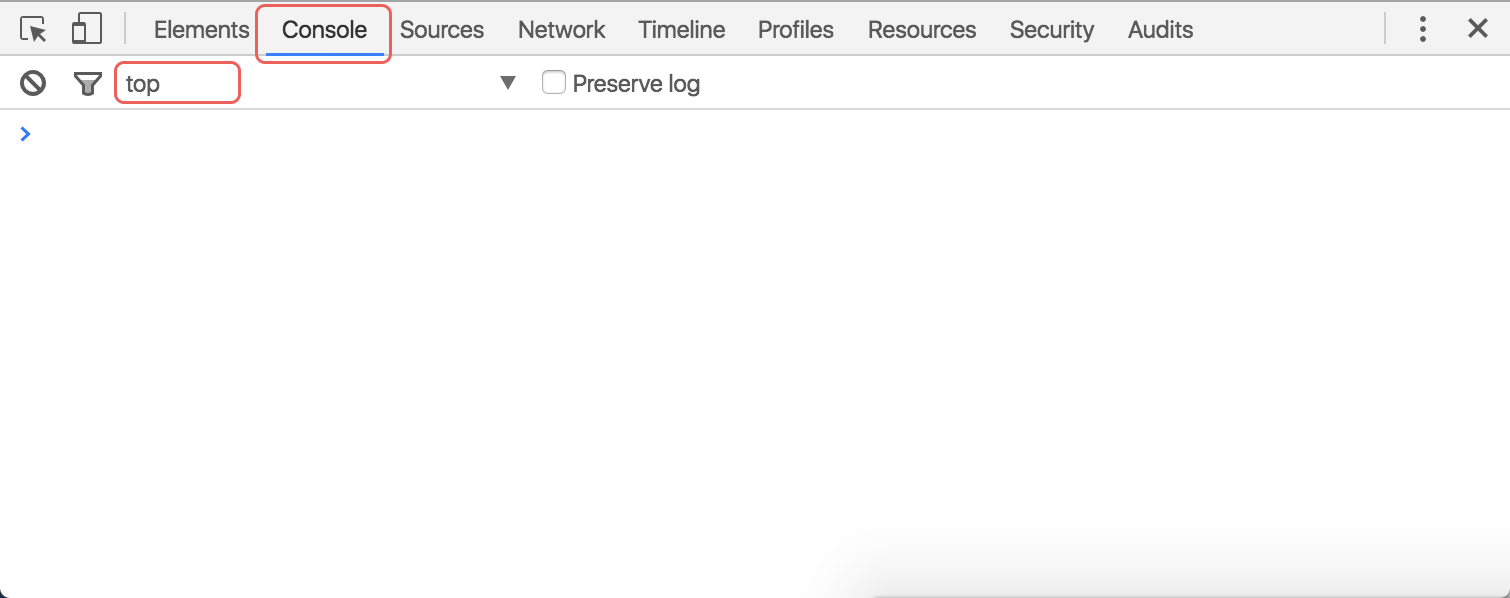
Desktop Developer Tools Console
Enable web SDK logging
- You should see
undefinedas the result. - Close the tab and open a new one to the same page. Refreshing alone won’t trigger all SDK initialization events.
- You will start to see OneSignal SDK logs in the Console.
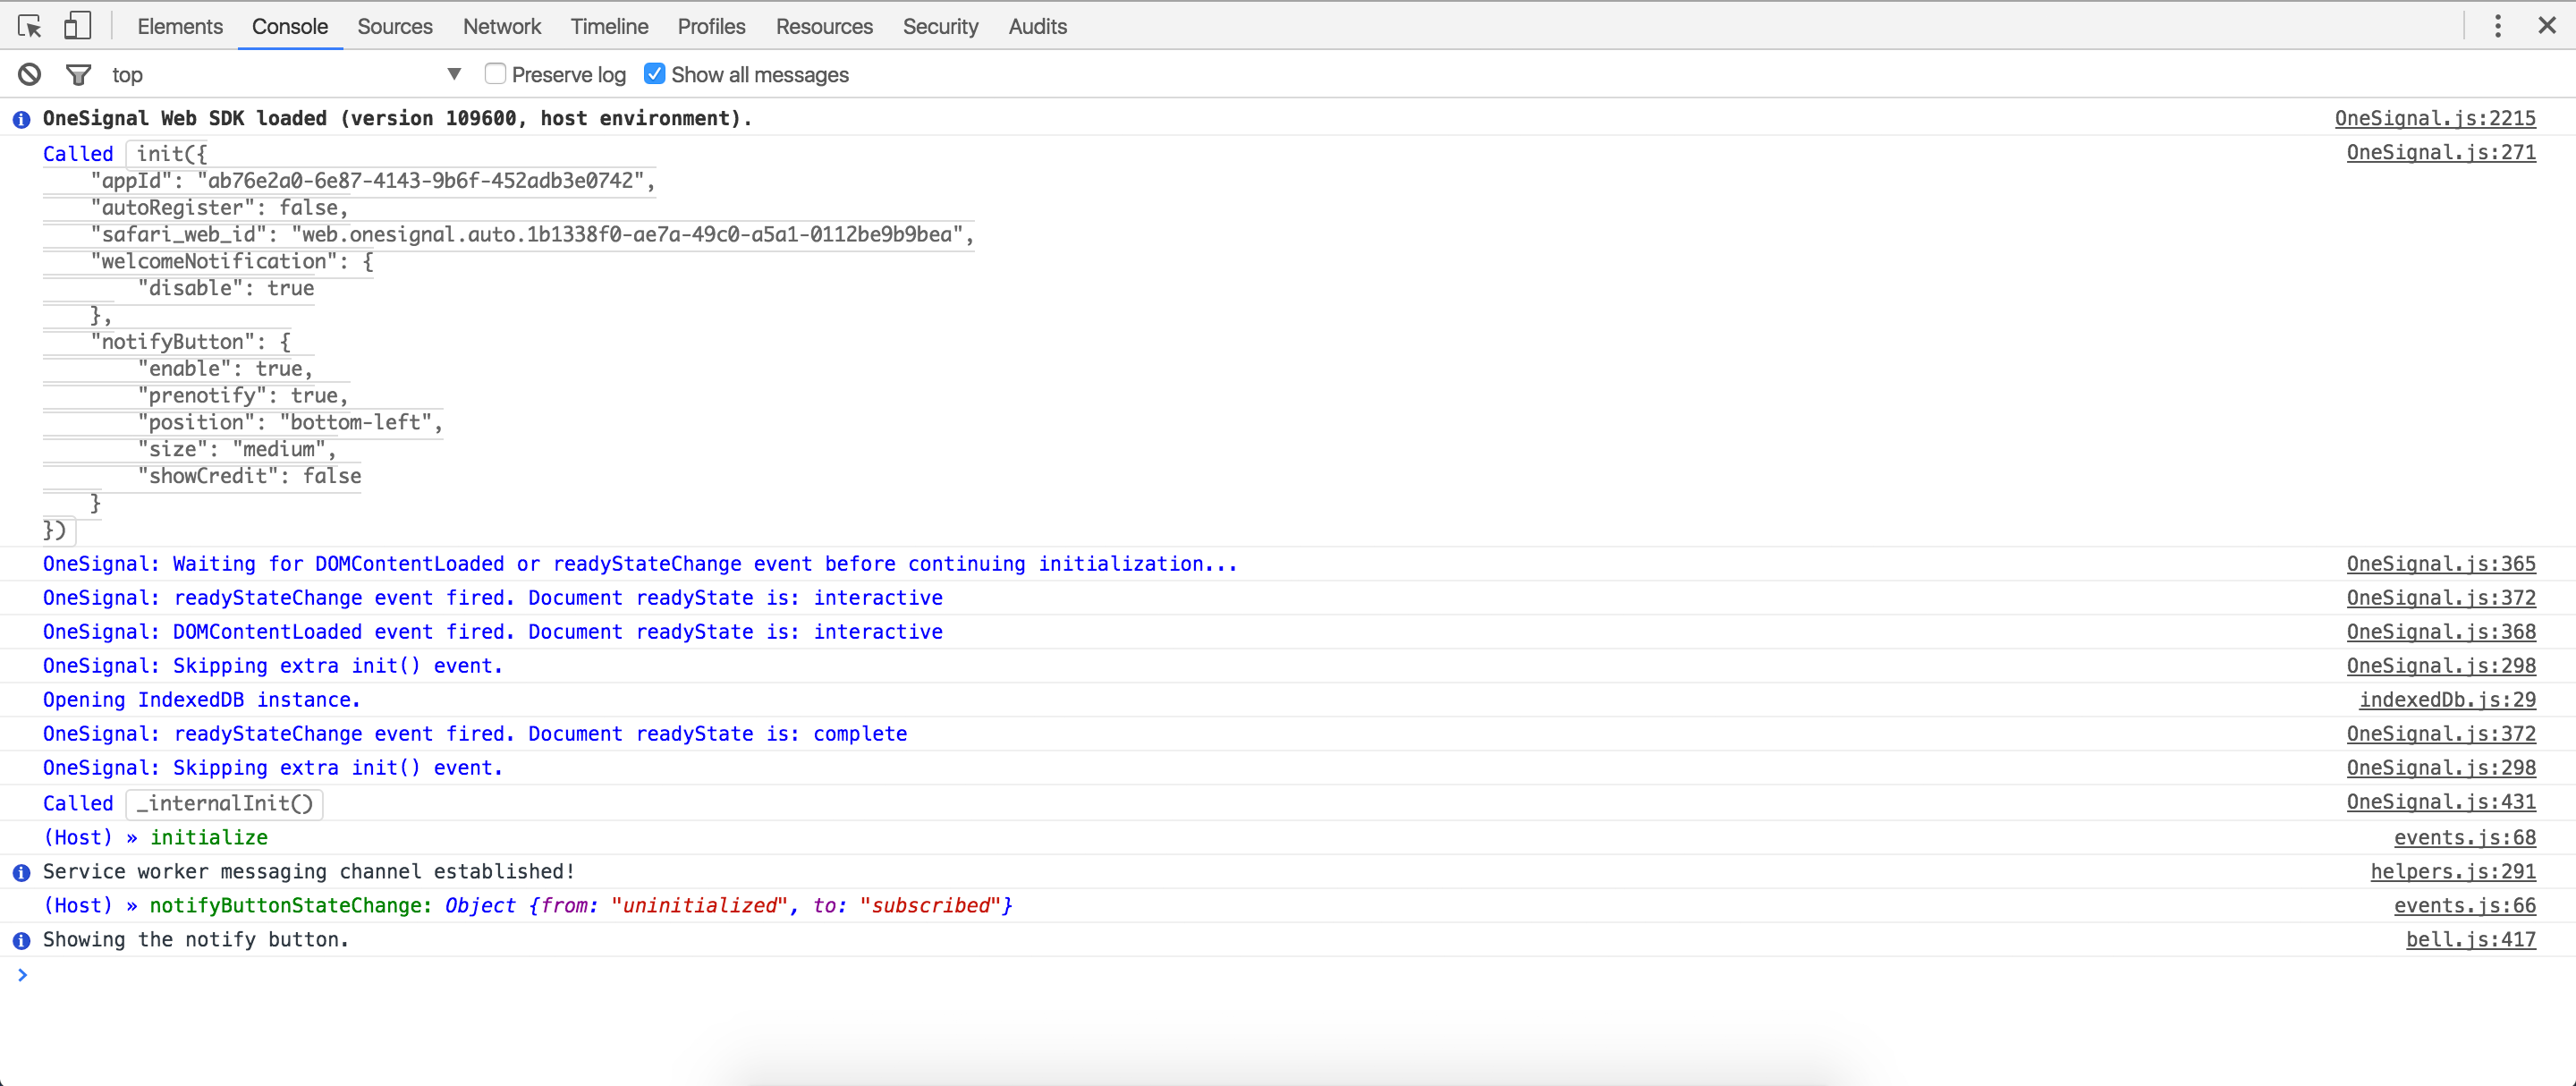
Console with verbose SDK logs
Configuration errors
You may encounter the following errors after OneSignal initializes:
Duplicate SDK initialization error
init code is being called more than once, often caused by combining WordPress plugin or Shopify integration setup with manual code or accidentally adding the OneSignal init code multiple times.
How to fix: Remove any duplicate init calls. If using the WordPress plugin or Shopify integration, remove any manual OneSignal code from your files.
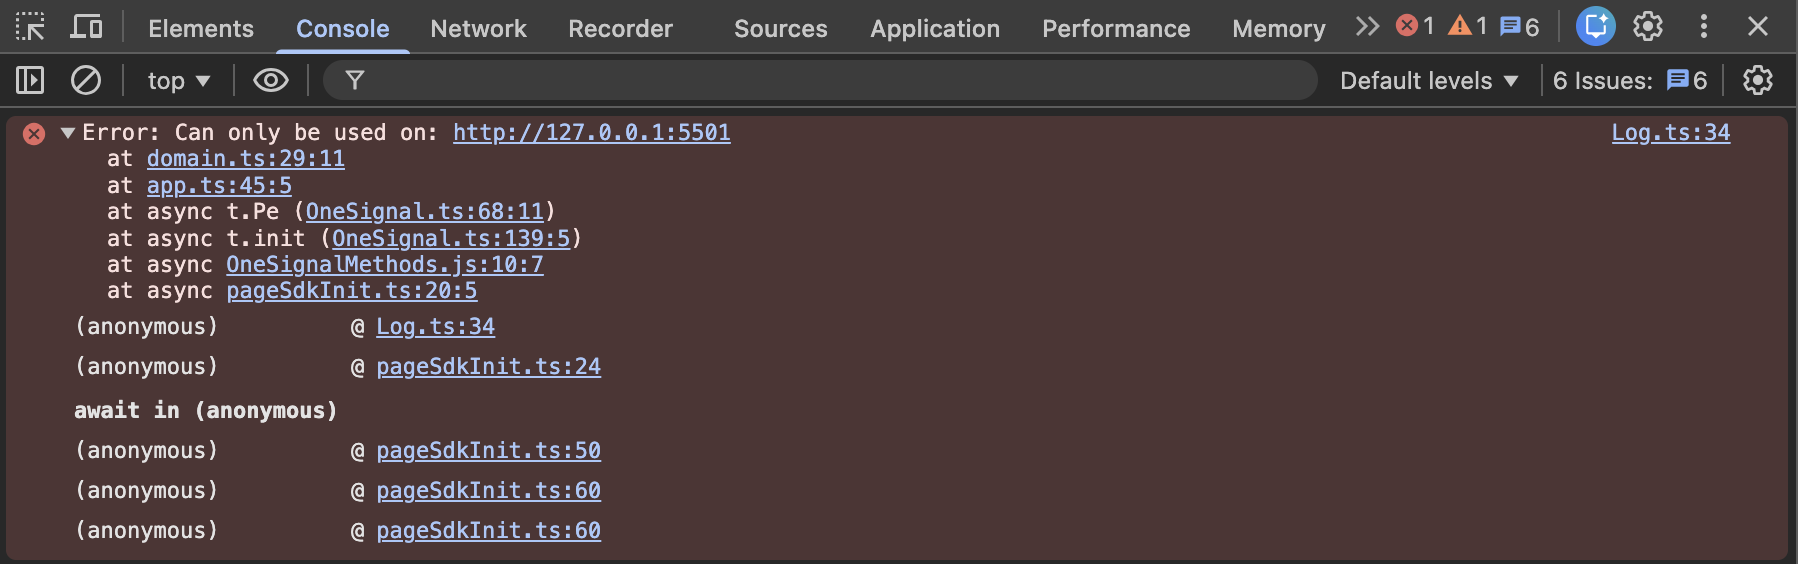
Example shows the URL set in OneSignal dashboard http://127.0.0.1:5501 is not the current site origin you are visiting.
- Protocol: Must be
https://(for local testing, see Localhost configuration) - Domain:
example.comvswww.example.com - Subdomain:
app.example.comvsexample.com
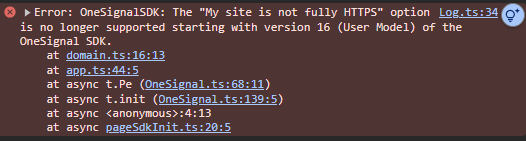
Example of the HTTP site not supported error
https://your-label.os.tc, not your actual site origin. Web push is not supported on HTTP sites or websites that cannot host service workers.
How to fix: Both options require your users to resubscribe because they are subscribed to the os.tc subdomain, not your site.
- Create a new OneSignal App and set the new App ID in your init code. This lets you continue sending push from the old app to notify users. Send notifications letting users know the site has been updated and they should resubscribe. Offering a discount or incentive helps. Set the “Launch URL” to a landing page with a resubscription prompt (Bell, Custom Link, or Category Slide). See Permission prompts for details.
-
Keep the same App ID by using the Update an App API to update
chrome_web_originandsafari_site_originto your HTTPS origin. Because users subscribed to theos.tcsubdomain, their browser does not have push permissions for your actual domain. They will be prompted again, and if they resubscribe, they will have two web push Subscriptions on the same browser — causing duplicate notifications. To prevent duplicates, delete all current web push subscribers before updating. Send a few notifications first letting users know they should resubscribe. See Permission prompts for prompt options.
Service worker installation errors
If you are presented with the Native permission prompt and click “Allow”, you may encounter the following service worker installation errors:https://your-site.com/’) with script (‘https://your-site.com/...’): A bad HTTP response code (404) was received when fetching the script.https://www.yoursite.com/’) with script (‘https://www.yoursite.com/...’): A bad HTTP response code (403) was received when fetching the script.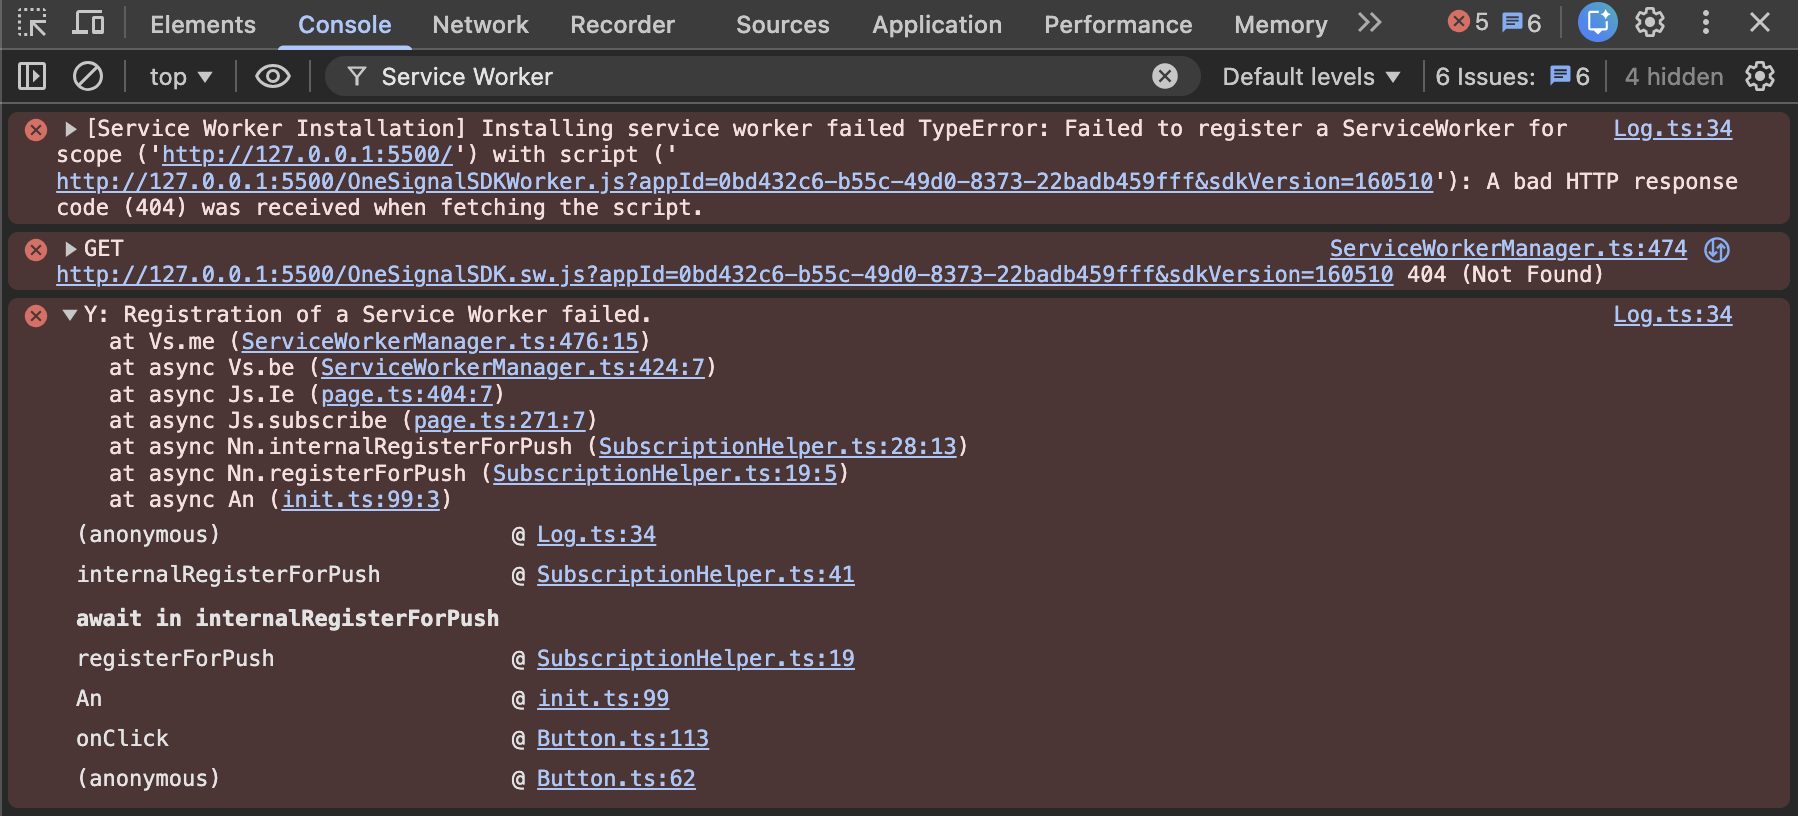
Example of a service worker installation error

MIME type error in service worker

Redirect error in console
Find your service worker path
OneSignalSDKWorker.js service worker file in the root directory of your site unless you specify a custom filename or location as described in the Service Worker setup guide.Make sure you have configured the correct filename, location, and scope for the SDK to find the service worker file.Visit the service worker file directly in your browser
- If you did not configure a custom location, then you should see the JavaScript code for the service worker file in your site’s root:
https://yoursite.com/OneSignalSDKWorker.js - If using WordPress, you should see it here:
https://yoursite.com/wp-content/plugins/onesignal-free-web-push-notifications/sdk_files/OneSignalSDKWorker.js - If using a custom location, you should see it here:
https://yoursite.com/your-custom-location/OneSignalSDKWorker.js
Verify the file loads
- You should see the following JavaScript code:
JavaScript
- This file must be served with a
content-typeofapplication/javascript. - There can be no redirects to this file. Files must be hosted on the same domain as your site (no CDN or proxy domains).
Notifications not shown
This section assumes:- You have reviewed the Notifications not shown: Web Push guide for common reasons why notifications may not be showing up on your device.
- You were shown the Native permission prompt and clicked “Allow”. See Prompt display issues above if you did not subscribe via the Native permission prompt.
Get your Subscription ID
- The URL of the page you are on if there is any confusion.
-
If the current browser supports push notifications.
truemeans the browser supports push notifications.falsemeans the browser does not support push notifications.
-
If you are subscribed to notifications in the browser.
truemeans you allowed push permissions for this URL.falsemeans you did not allow or denied push permissions for this URL.
-
If you are opted-in with OneSignal.
truemeans your Subscription is subscribed to push notifications in OneSignal.falsemeans your Subscription is not subscribed to push notifications in OneSignal. Check if theoptOut()method is being called on your site.
-
Your OneSignal Subscription ID.
- Save this for the next step. This is the ID you will use to send yourself a push notification.
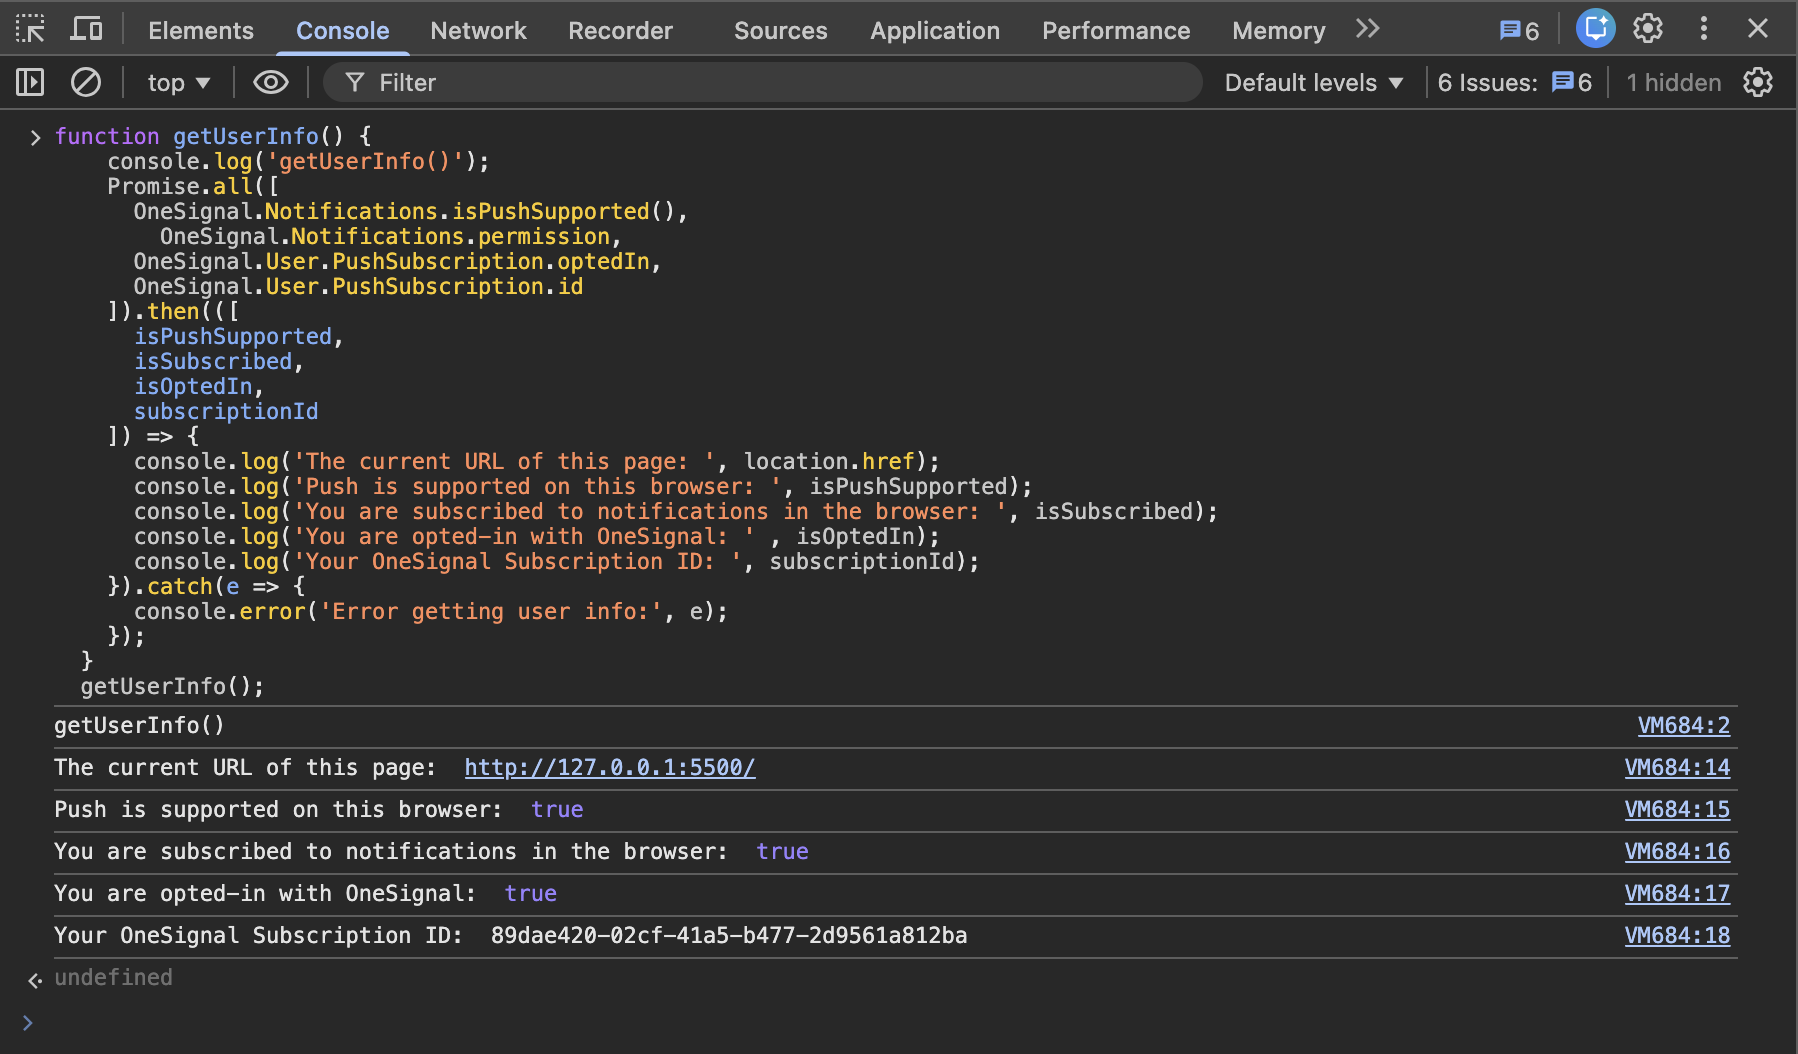
Example of user info output in the console
Send yourself a notification
Test with Chrome
- In a new tab, open
chrome://gcm-internals. - Click the “Start Recording” button on the top left. Making sure you see “Connection State: CONNECTED”.
- Leave this open and send yourself another push notification to your Chrome web push Subscription.
- You should see something in the “Receive Message Log” if you got it.
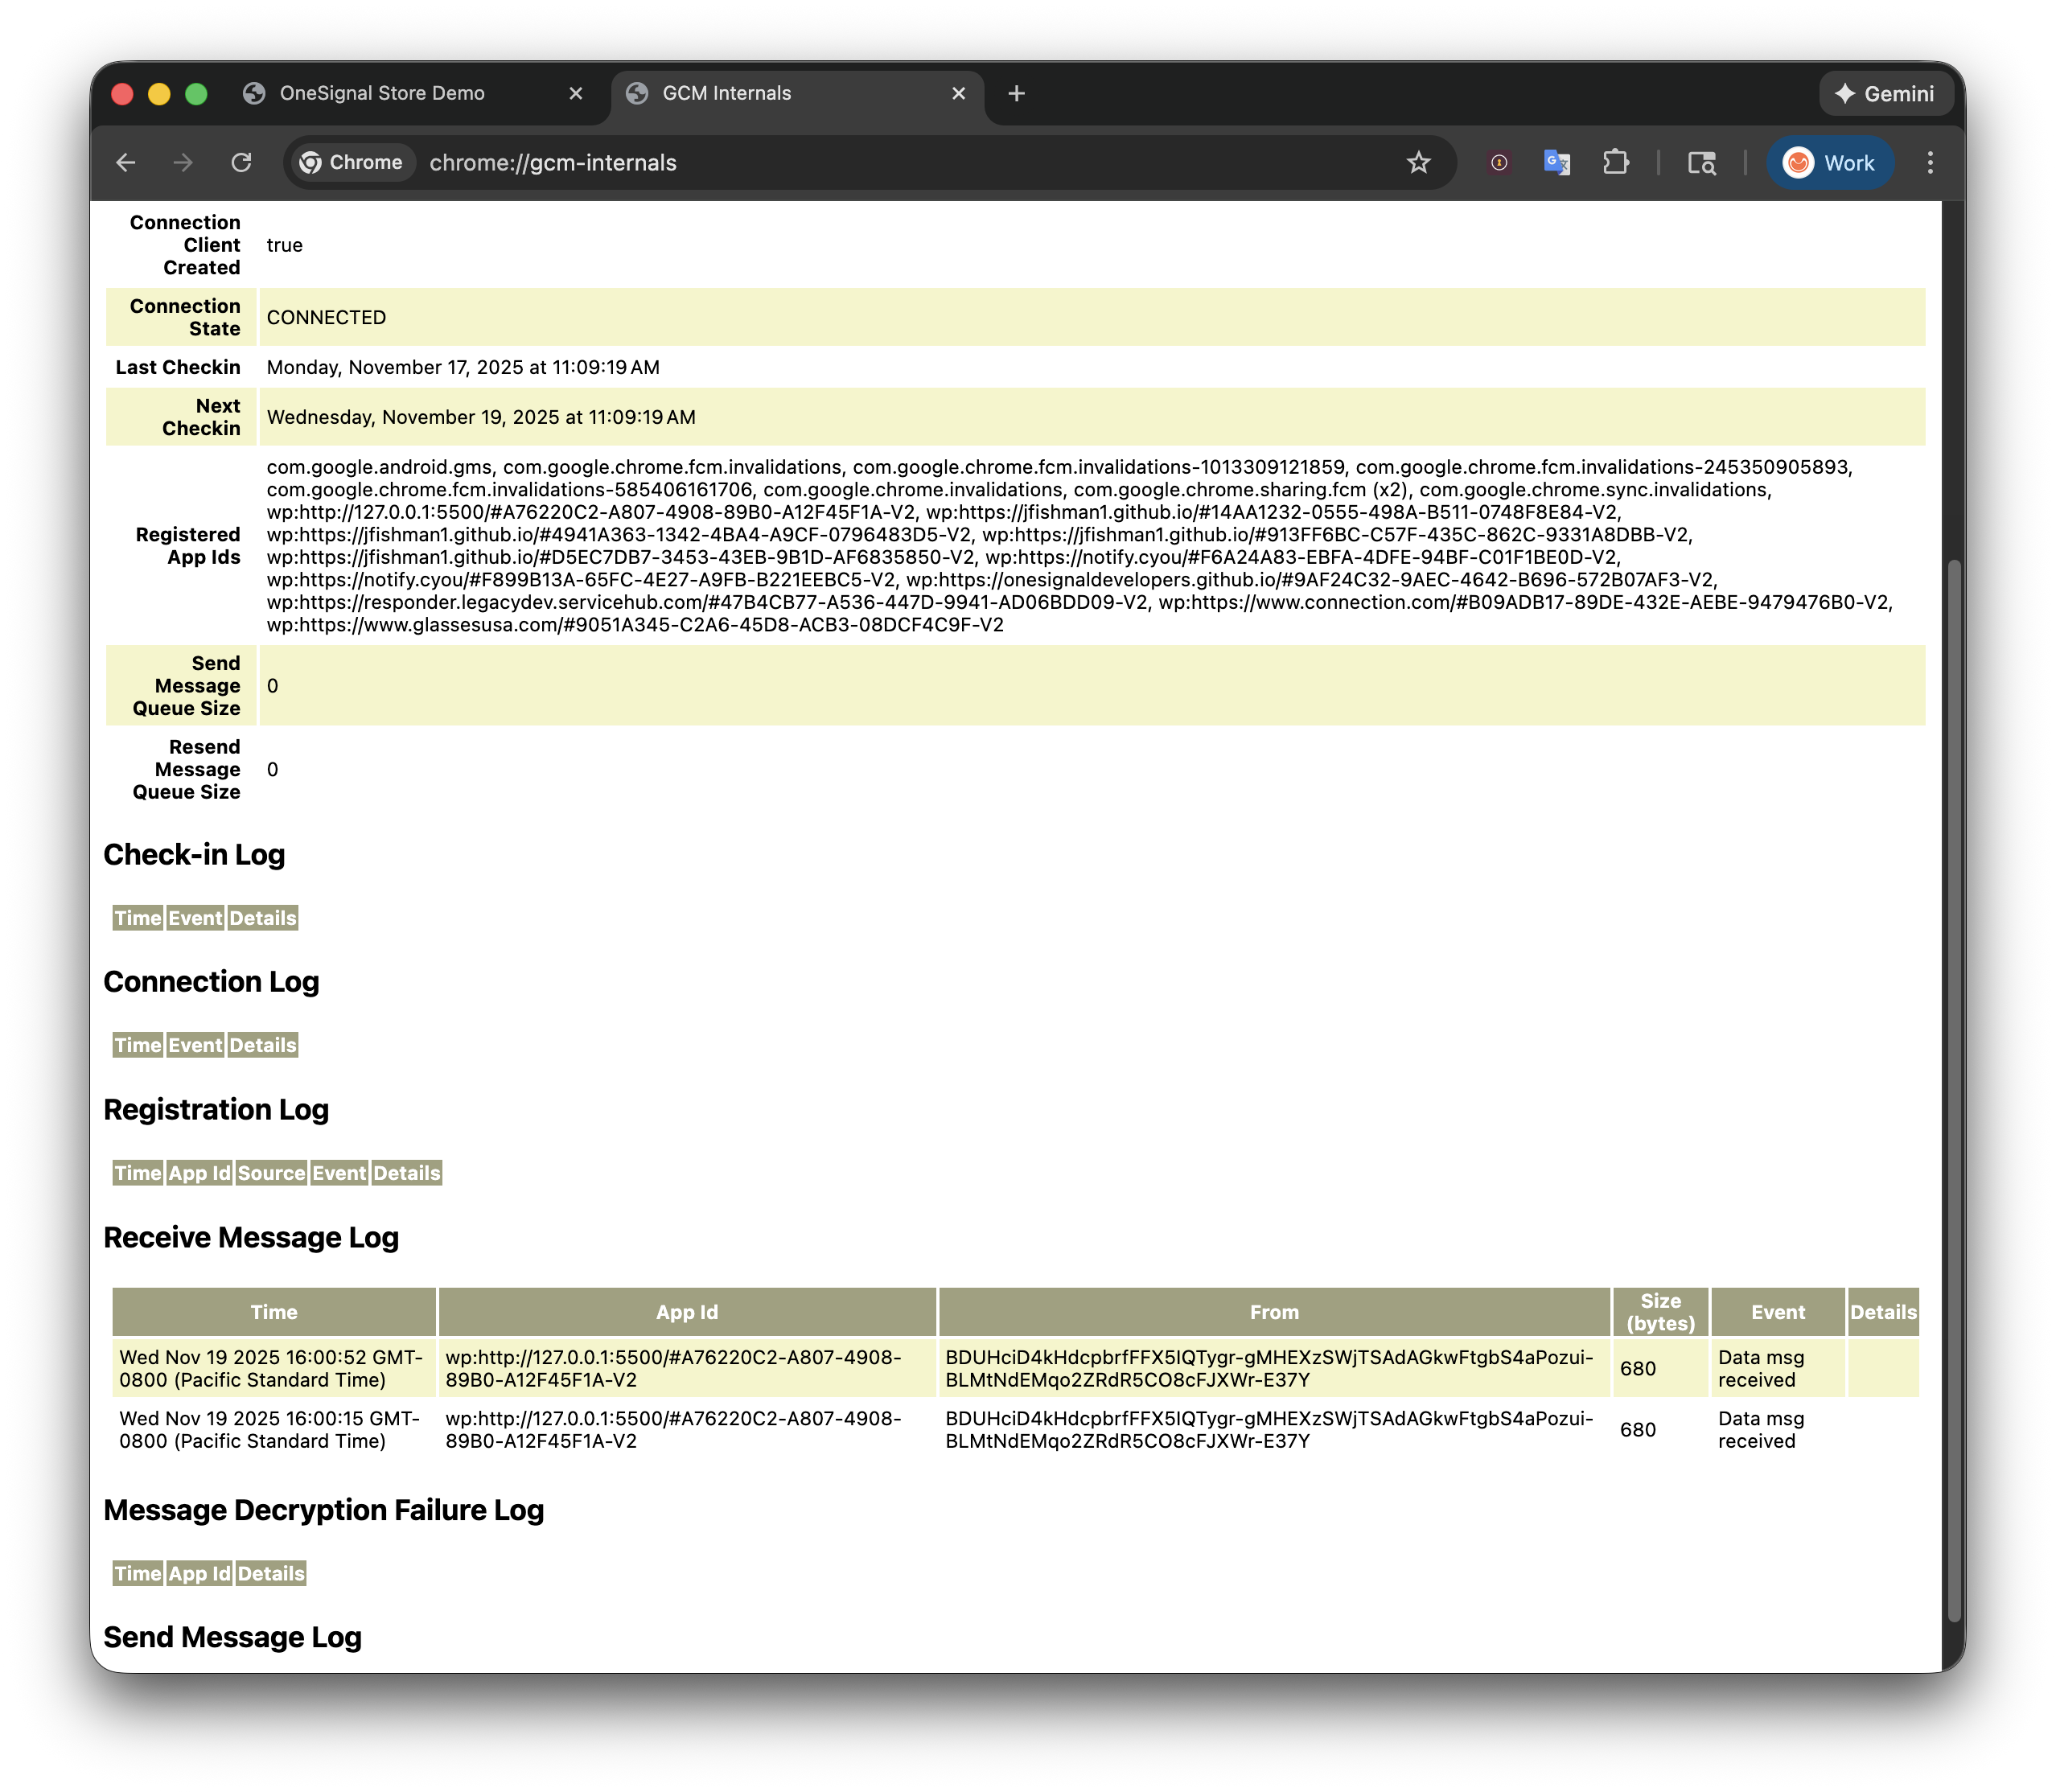
GCM internals logging
- If you don’t see a “Data msg received”, then your Chrome browser is not receiving the notification at all. Contact OneSignal Support with the GCM internals logs.
- If you see “Data msg received” but you still didn’t receive a notification, continue to the next step.
- Open a new tab to
chrome://serviceworker-internals - Search for
Scope: https://your-site.com(replaceyour-site.comwith your actual site domain). - Click Inspect, or Start -> Inspect. A Chrome Developer Tools popup will appear.

Inspecting the service worker
- On the Chrome Developer Tools popup to our service worker, click the Console tab, and run
OneSignalWorker.log.trace();. It should returnundefined. Any messages from our service worker should now appear in this popup.
support@onesignal.comPlease include:- Details of the issue you’re experiencing and steps to reproduce if available
- Your OneSignal App ID
- The External ID or Subscription ID if applicable
- The URL to the message you tested in the OneSignal Dashboard if applicable
- Any relevant logs or error messages
FAQ
Why do I see “SDK already initialized”?
The OneSignal Web SDKinit code is being called more than once on the page. This commonly happens when combining the WordPress plugin with manual code, or when the init tag is included in multiple page templates. Remove duplicate init calls to resolve it.
Can I use web push on HTTP sites?
No. Web push requires HTTPS because service workers — which handle push delivery — only work on secure origins. If you previously used the “My site is not fully HTTPS” option, you must migrate to HTTPS. See Configuration errors for migration steps.How do I test web push on localhost?
You can test onlocalhost during development. See Localhost configuration for setup instructions. Note that localhost testing only works in Chromium-based browsers.