Engagement Trends retains up to two years of data depending on your pricing plan. Data is available starting January 10, 2025.
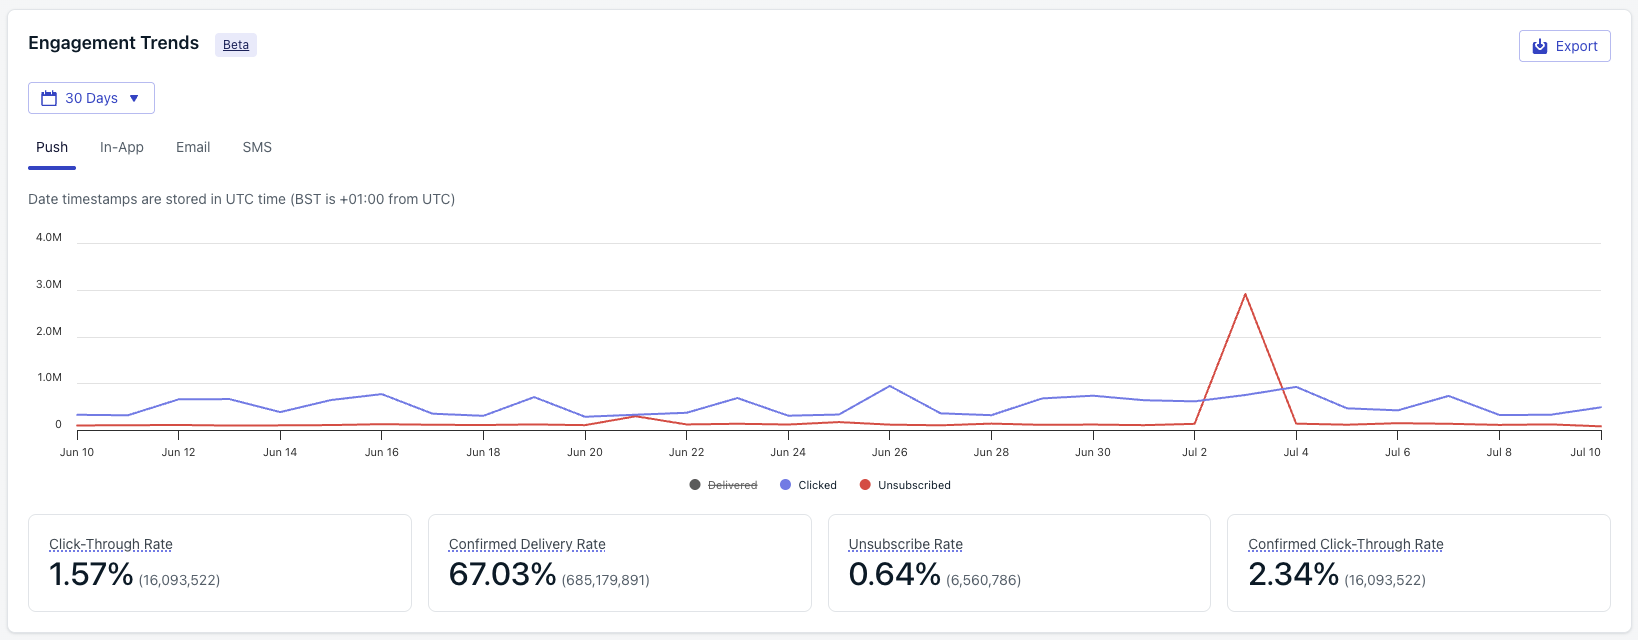
Engagement Trends chart
Metrics by channel
- Push
- In-app
- Email
- SMS
- Live Activities
Push message reports
Per-message delivery, click, and confirmed-receipt breakdowns for push notifications.
Metrics glossary
Canonical definitions for every metric across the dashboard, API, CSV, and Event Streams.
Export chart data
1
Filter the chart
Set the time range and messaging channel you want to export.
2
Start the export
Click the export button at the top right of the chart.
3
Receive the CSV
OneSignal emails the CSV to the address on your current OneSignal user account. The file contains per-day engagement statistics for the filtered range.
FAQ
How far back does Engagement Trends data go?
Data is available starting January 10, 2025. Retention is up to two years depending on your pricing plan.Why do my Engagement Trends numbers differ from an individual message report?
Engagement Trends aggregates every message sent in the filtered time range across the selected channel, including messages sent from the API and Journeys. Individual message reports show only that one send. Small rounding differences between the rate calculations shown here and on per-message reports can also occur because Engagement Trends groups by day.Why does SMS Delivered on this chart differ from the count in Twilio?
OneSignal’s SMS Delivered reflects carrier-confirmed receipt reported back by Twilio. Differences usually come from messages still in flight at comparison time, late status callbacks from carriers, or messages that moved to Provider Undelivered after initial acceptance. See the Metrics glossary for the full SMS lifecycle.Can I get raw per-event data instead of aggregated daily statistics?
Yes. Use Event Streams to forward real-time message events to your own analytics stack, or Exporting data to download the Notifications CSV for a range of messages.Why is Live Activities Unsubscribed counted when a user dismisses the activity?
Once a user dismisses a Live Activity or disables Live Activities in device settings, APNs returns an error indicating the activity token is no longer valid. OneSignal counts these push subscriptions as unsubscribed for Live Activity delivery and stops sending further updates.Related
Metrics glossary
Canonical definitions for every metric across push, email, SMS/RCS, in-app, and Live Activities.
Analytics overview
Tour the dashboards, APIs, and export tools OneSignal provides for measuring performance.
Event Streams
Send real-time message events to your warehouse for custom analysis.
Exporting data
Export message and subscription data to CSV for offline analysis.