Journey report
To view a report of the entire Journey, open the Journey and click Journey Report at the top. This report shows how your Journey performs over time and provides a high-level view of trends and success metrics. Metrics are based on the number of users moving through the Journey.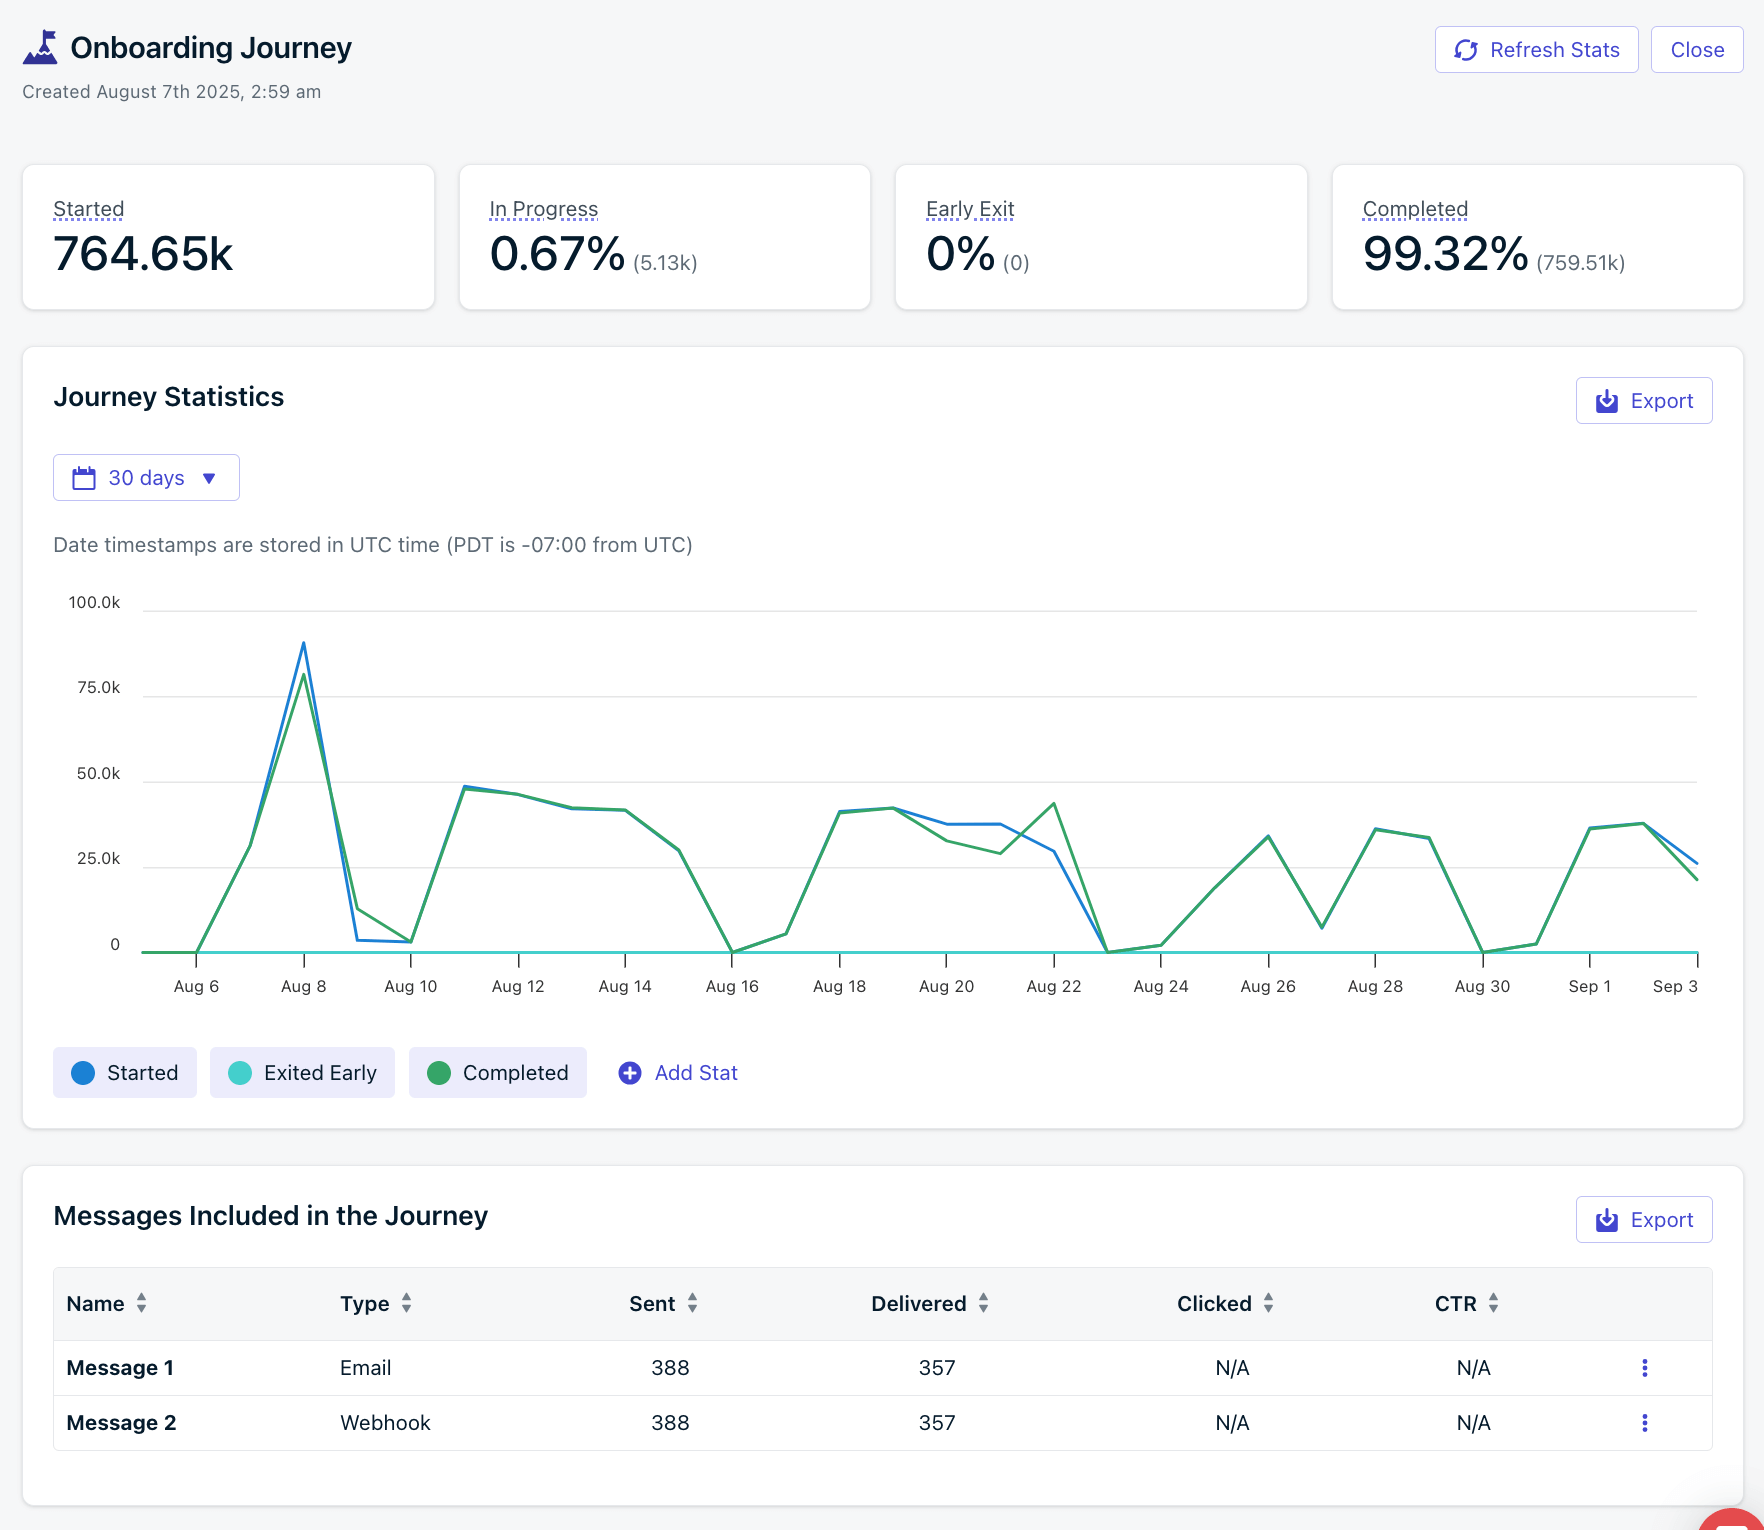
Journey report showing entry, exit, and message stats
Journey stats
High-level stats for the entire Journey. Graph data and Audience Activity are only available for 30 days.Journey step stats
Each step in the Journey shows high-level stats for its lifetime.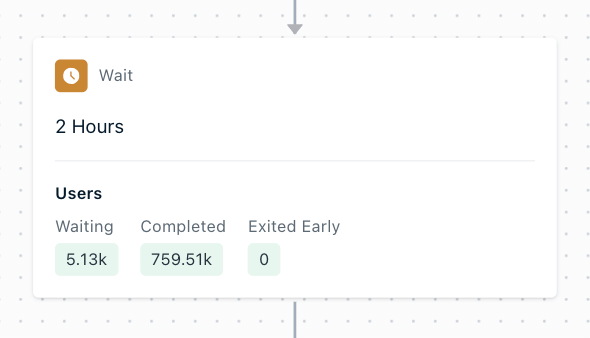
Journey step stats for a Wait node
Push stats
Click a push message step to see detailed message reports.In-app message stats
Click an in-app message step to see detailed message reports.Email stats
Click an email message step to see detailed message reports.SMS stats
Click an SMS message step to see detailed message reports.Journey message reports
Within the Journey editor, click a message step to open its delivery report. These message-level reports are based on the number of Subscriptions that were sent the message. For example, if 1 user entered the Journey and had 2 subscribed Subscriptions for the message channel (push, email, etc.), then 2 messages will be sent (one for each Subscription). Top-level stats are for the lifetime of the message. For details on each metric, see: Graph data and Audience Activity are only available for 30 days. This data is also available in Template Analytics.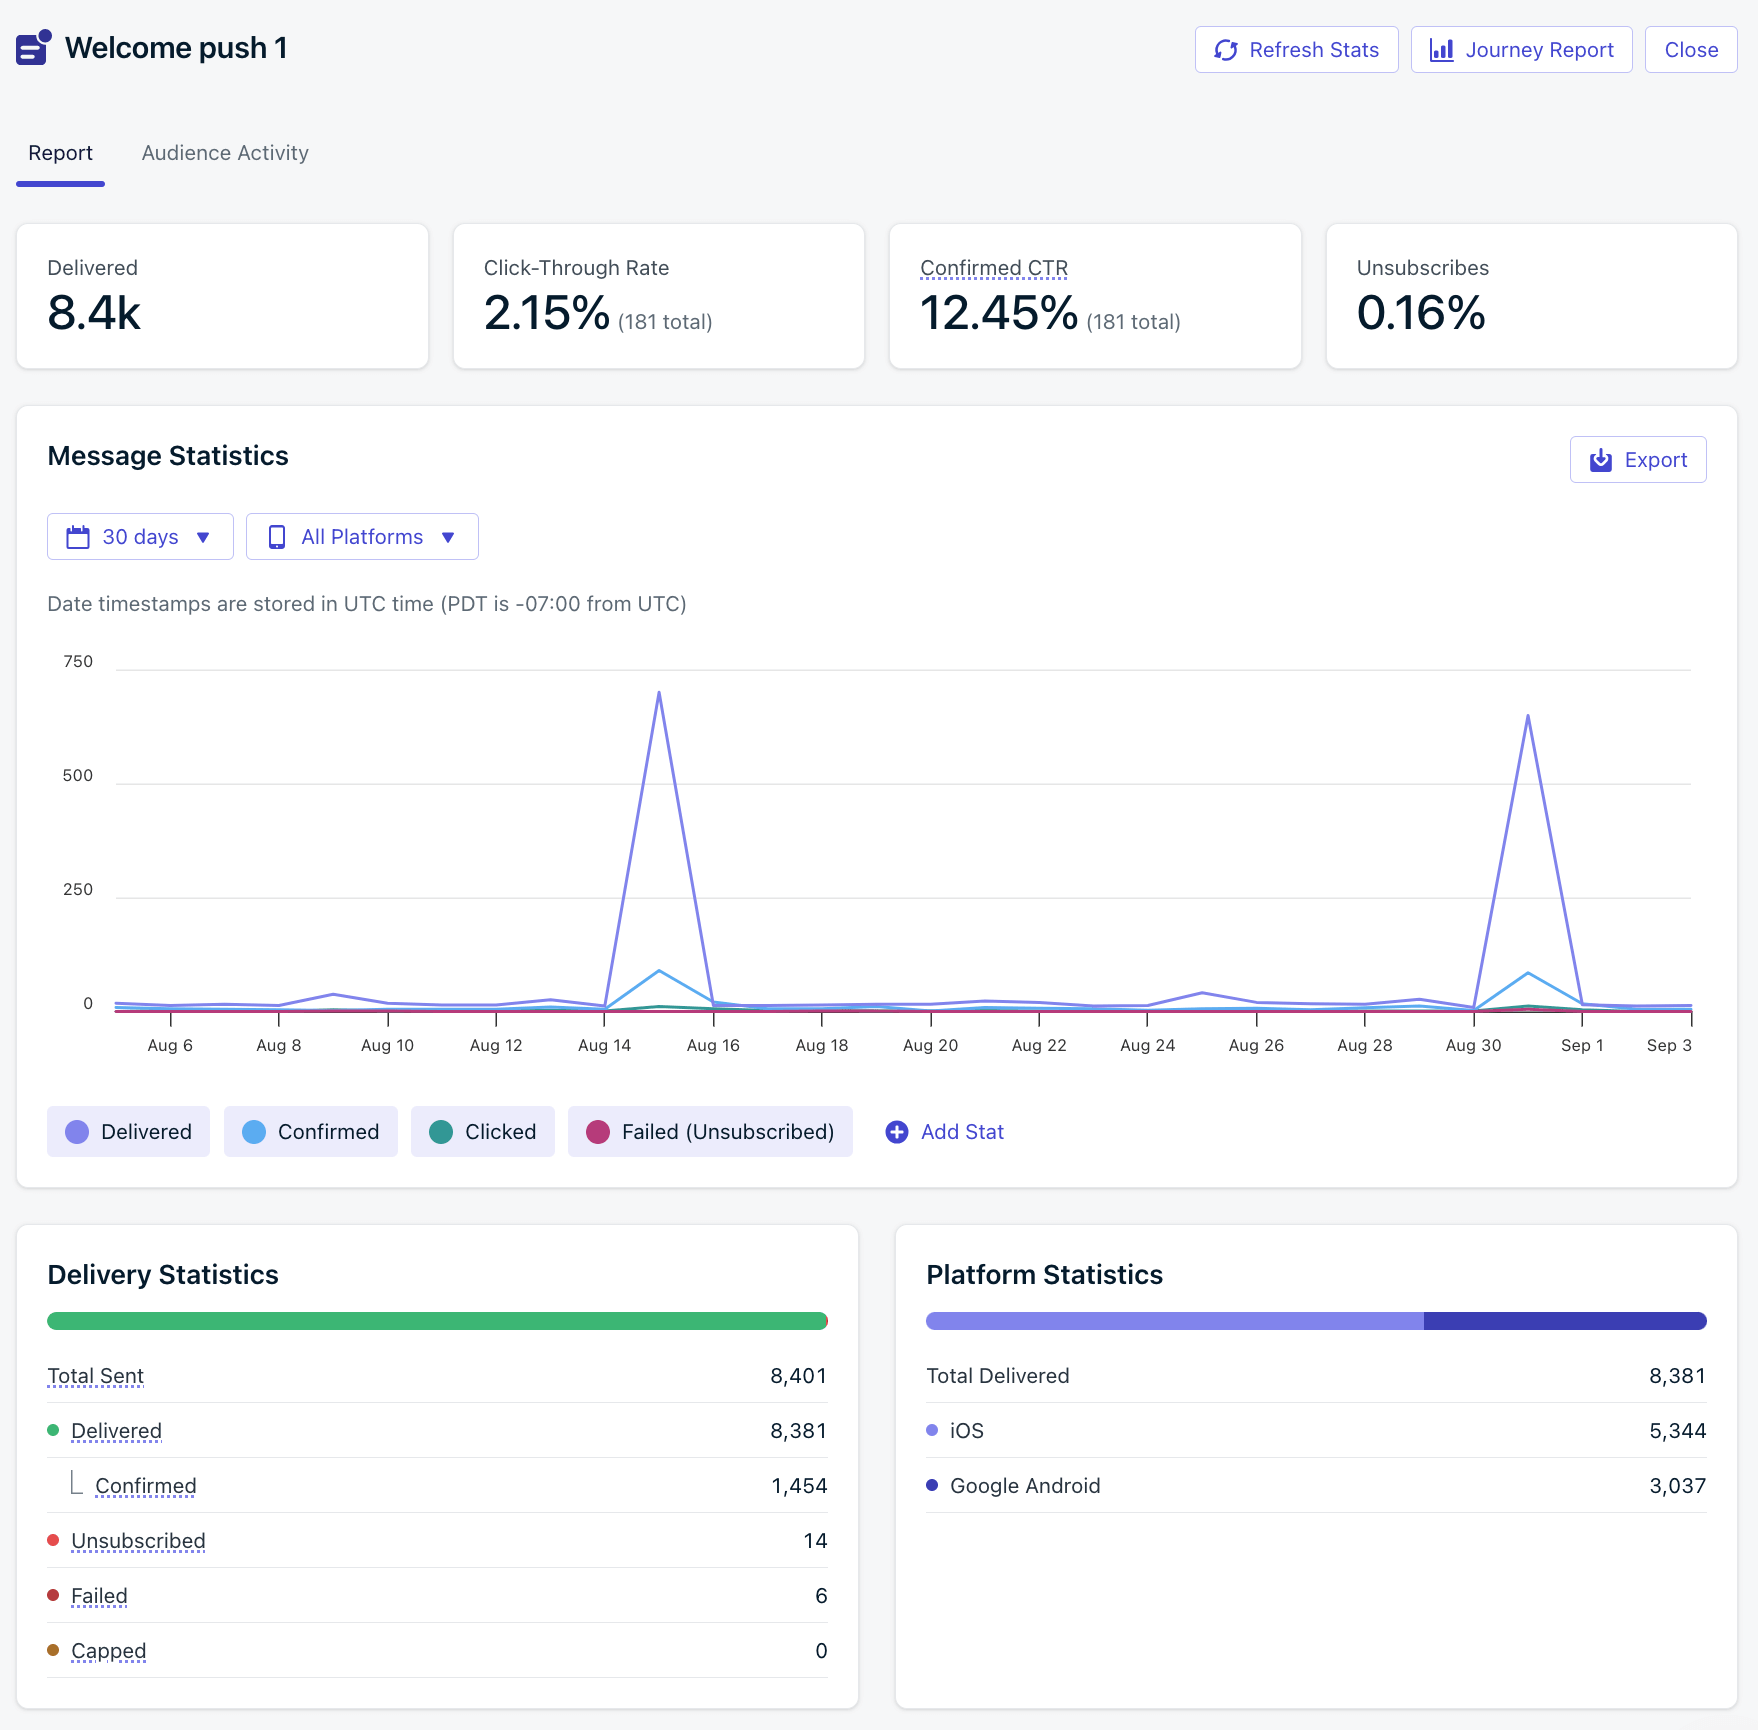
Push notification message report within a Journey
Audience activity
The Audience Activity section shows the users who were sent a message. You can export the full list of users for a given message step by clicking Export. This data is available for 30 days.Each user appears only once per tab. If a user re-enters and receives the same message multiple times, they will only appear once in the export for that step.
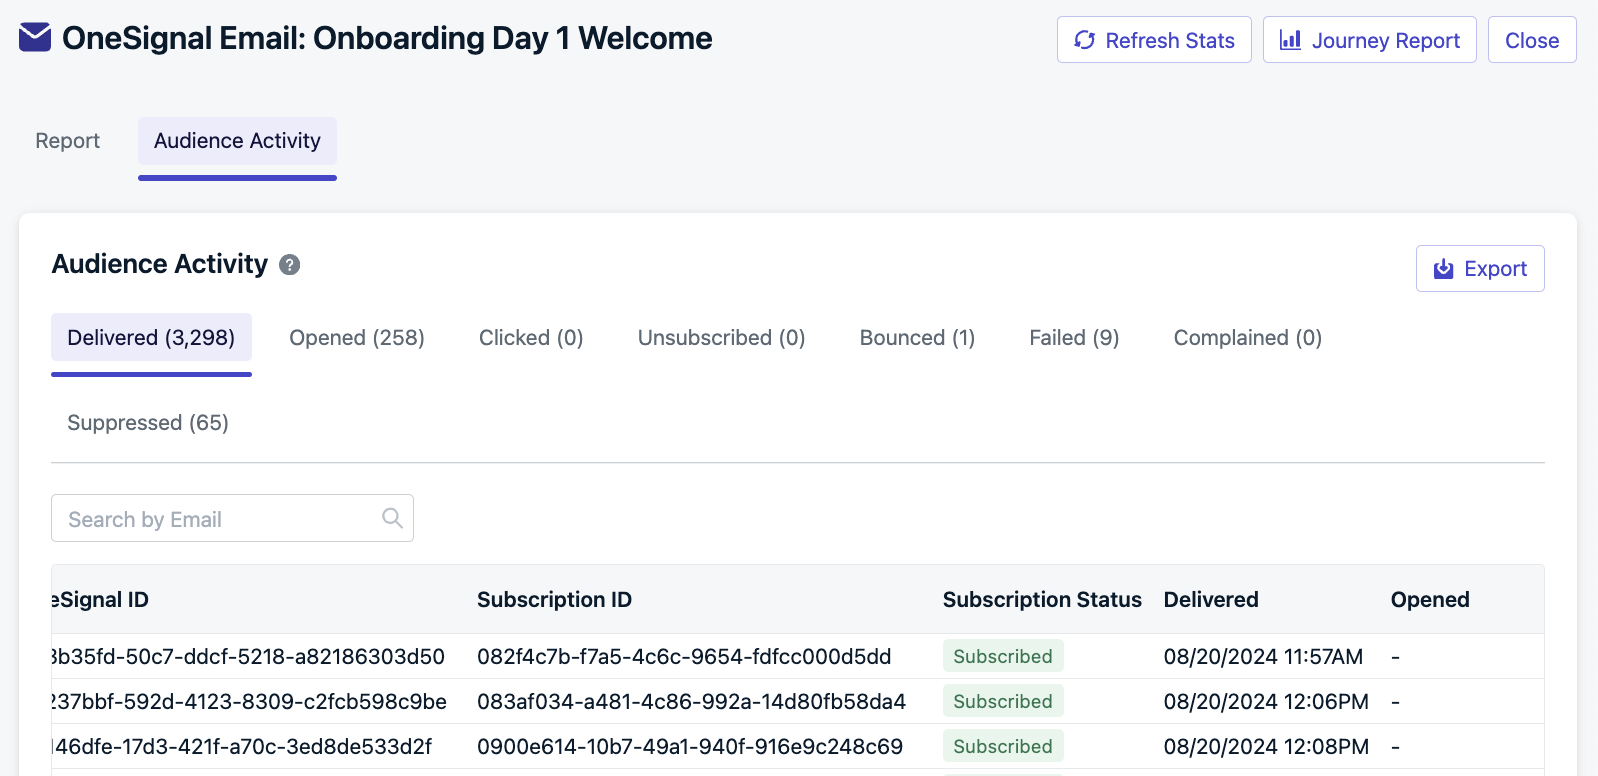
Audience activity report for a Journey message step
FAQ
How long is Journey analytics data retained?
Journey-level stats (Started, In Progress, Early Exit, Completed) and per-step stats are available for the lifetime of the Journey. Graph data and Audience Activity exports are retained for 30 days. To keep historical data, export it before the 30-day window closes.What does a high early exit rate mean?
It depends on your exit rules. If the exit rule is based on goal completion (for example, “user entered the Paid Customers segment”), a high early exit rate indicates successful conversions. If the exit rule is not goal-based, a high rate may mean users are dropping off before completing the Journey — review your audience targeting and message content.How can I improve a low CTR?
A low click-through rate usually means the message content or timing is not resonating. Try A/B testing different copy or templates using a split branch, personalizing messages with tags or Liquid syntax, or adjusting message timing with wait steps. Compare CTR across channels to identify which performs best.What do high bounce or failure rates mean?
High bounce rates usually indicate invalid email addresses, full inboxes, or domain issues. High failure rates mean OneSignal could not deliver the message at all. Review the Audience Activity export for specific failure reasons, and see Email deliverability and Suppressions for next steps.Why do Journey-level and message-level numbers not match?
Journey-level metrics count users, while message-level metrics count subscriptions. A single user with two email addresses subscribed to your app would count as 1 user at the Journey level but could generate 2 email sends at the message level.Related pages
Journeys overview
Introduction to Journeys and how multichannel workflows operate.
Journey settings
Configure entry rules, exit rules, re-entry, and scheduling.
Email message reports
Detailed delivery, open, click, and error metrics for individual email sends.
Push message reports
Delivery and engagement metrics for individual push notification sends.
Template analytics
Aggregate performance metrics across all sends of a template.
Exporting data
Export Journey data, Audience Activity, and message reports via dashboard or API.