

Users vs. Subscriptions: Journey-level metrics are based on Users, while message-level metrics are based on Subscriptions (e.g., devices, emails, phone numbers). Users may have multiple Subscriptions across channels.
Journey report
To view a report of the entire Journey, open the Journey and click Journey Report at the top. This report shows how your Journey performs over time and provides a high-level view of trends and success metrics. Metrics are based on the number of users moving through the Journey.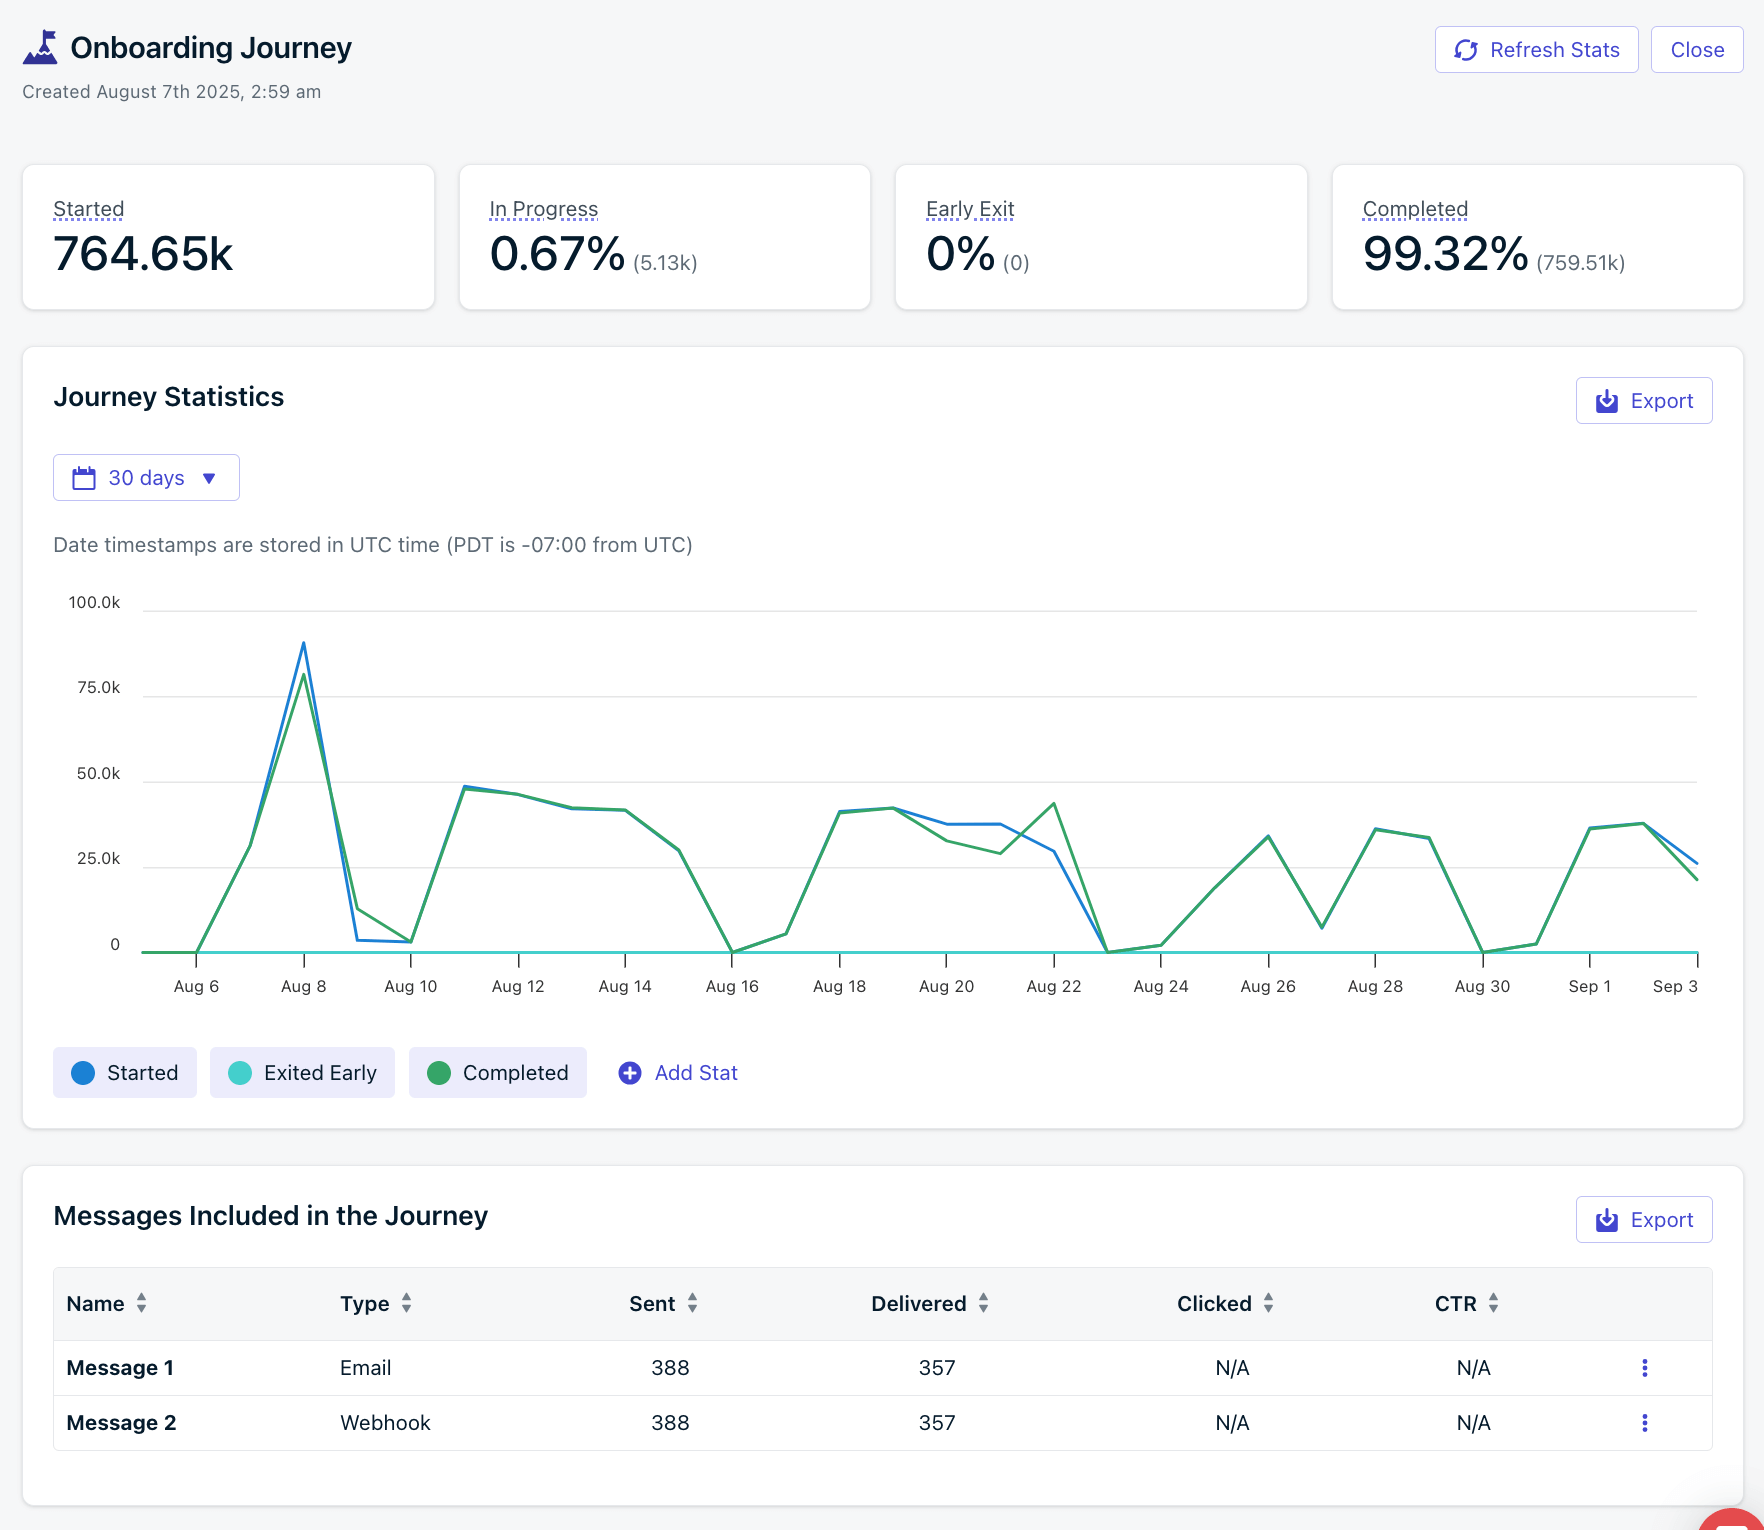
Journey report showing entry and exit stats, and included messages' stats.
Journey stats
High-level stats for the entire Journey. This data is available for the lifetime of the Journey. However, the graph and each message’s Audience Activity are only available for 30 days.Journey step stats
When looking at each step or node of the Journey, you can see high-level stats that are available for the lifetime of the Journey. This data is available for the lifetime of the Journey.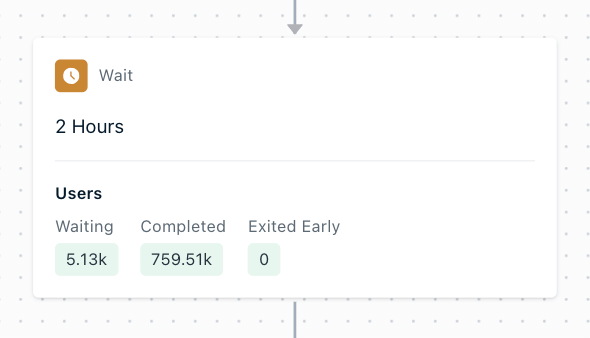
Journey step stats. Example Wait Node.
Push stats
High-level stats for the push message step. This data is available for the lifetime of the Journey. Click into the step to see more detailed message reports.In-app message stats
High-level stats for the in-app message step. This data is available for the lifetime of the Journey. Click into the step to see more detailed message reports.Email stats
High-level stats for the email message step. This data is available for the lifetime of the Journey. Click into the step to see more detailed message reports.SMS stats
High-level stats for the SMS message step. Click into the step to see more detailed message reports.Journey message reports
Within the Journey editor, click a message step to open its delivery report. These message-level reports are based on the number of Subscriptions that were sent the message. For example, if 1 user entered the Journey and had 2 subscribed Subscriptions for the message channel (push, email, etc.), then 2 messages will be sent (one for each Subscription). Top-level stats are for the lifetime of the message. For details on each metric, see: Graph data and Audience Activity are only available for 30 days. This data is also available in Template Analytics.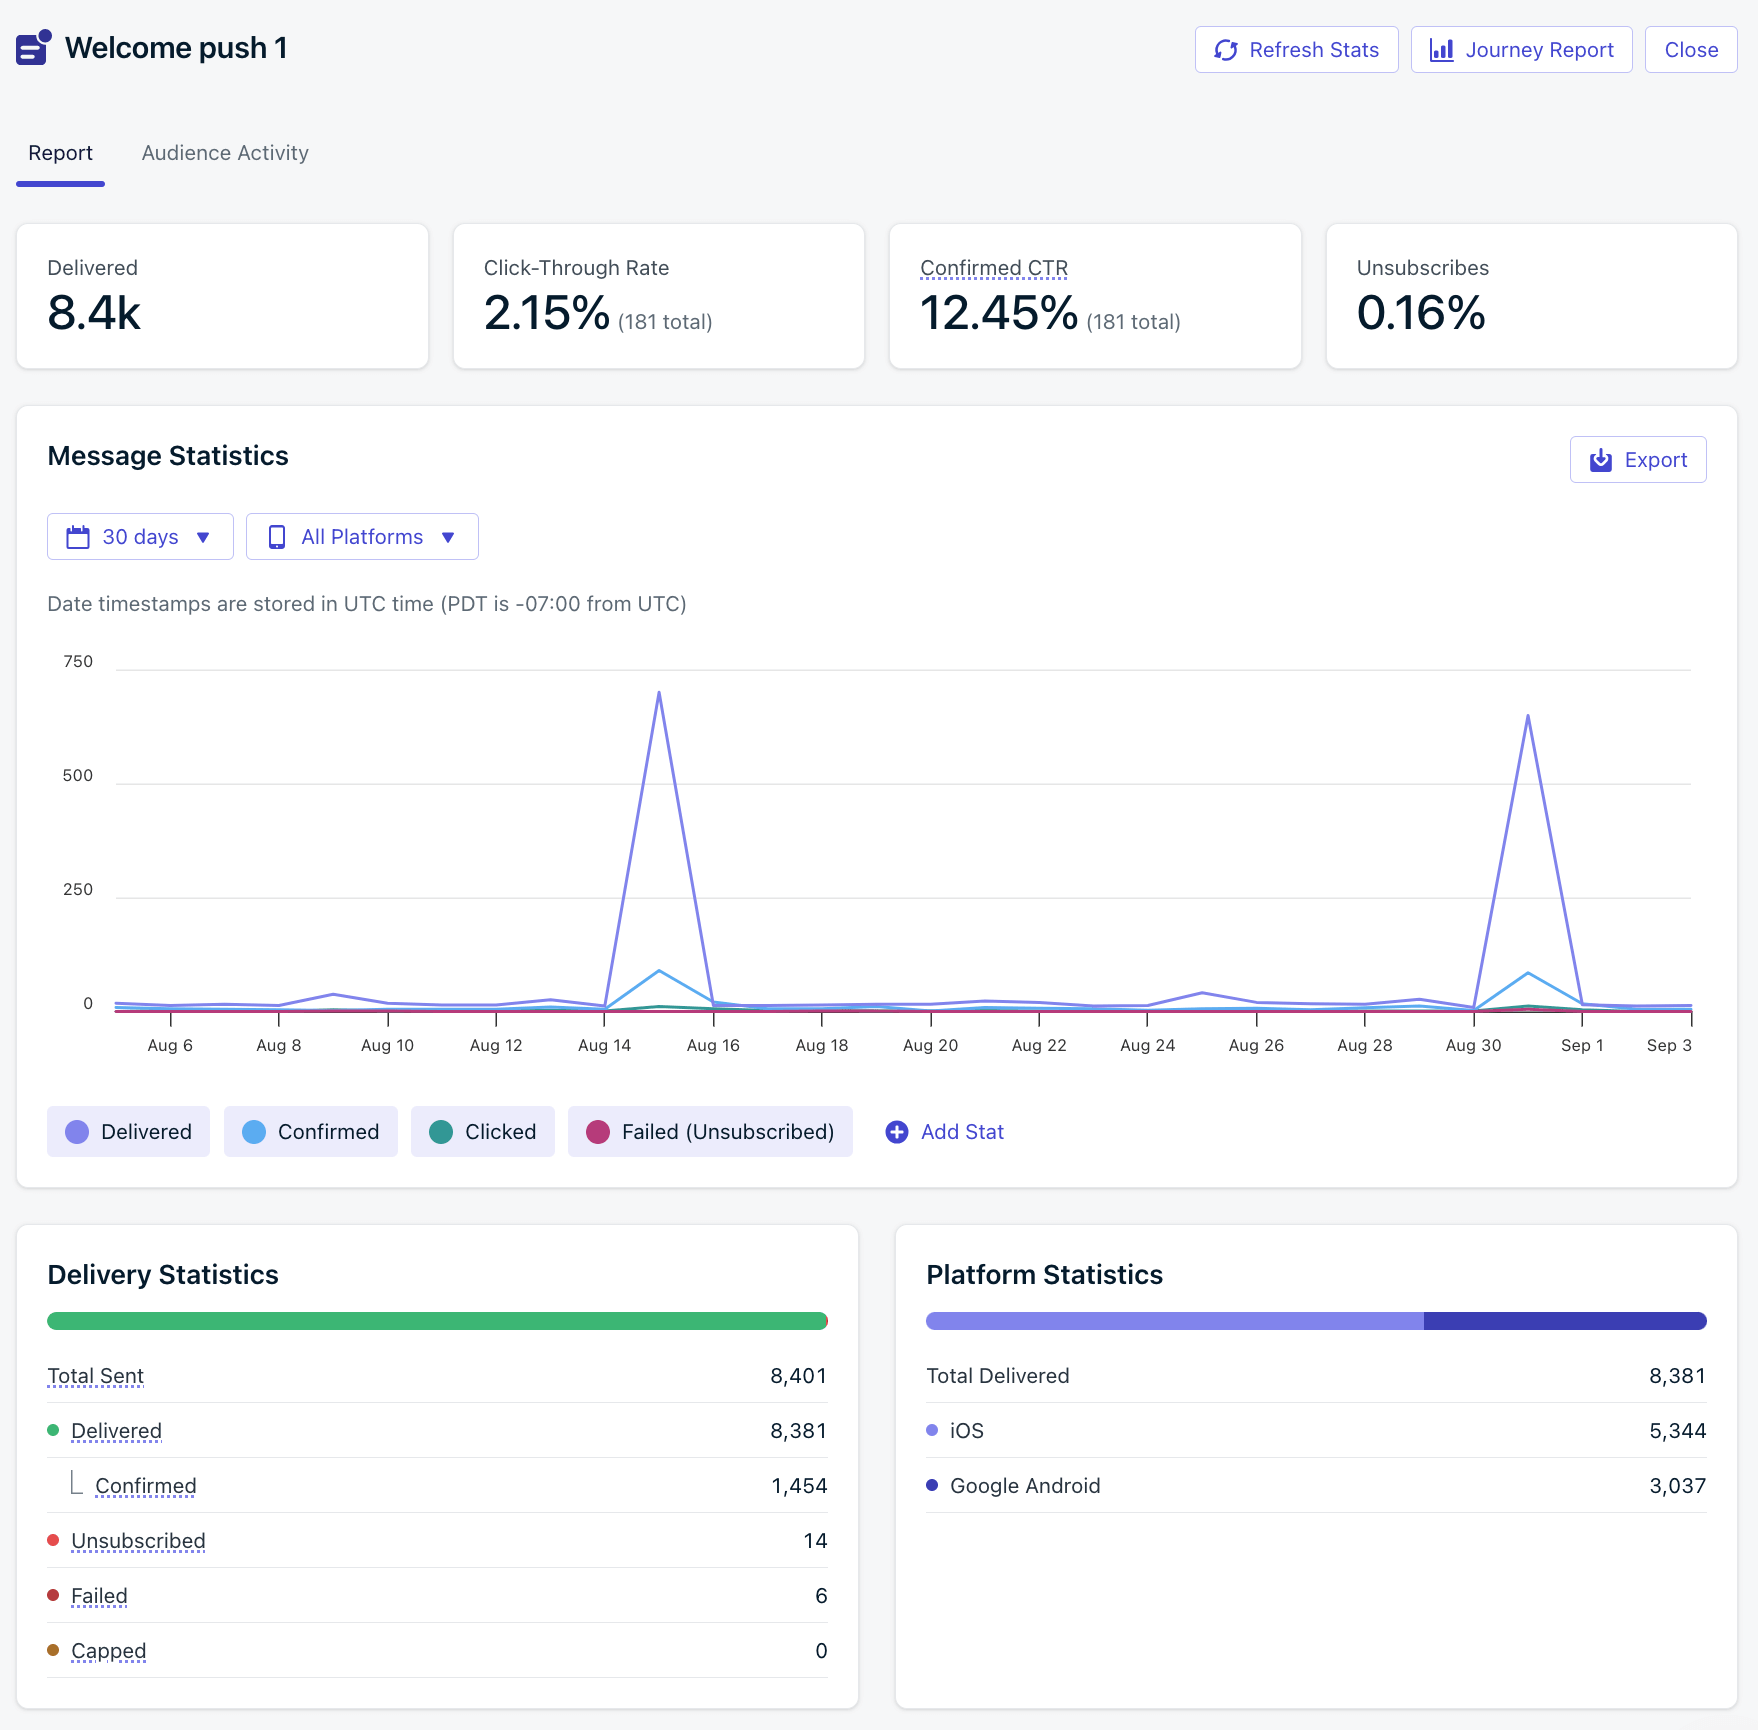
A message report showing a push notification's delivery stats
Audience activity
The Audience Activity section shows the users who were sent a message. You can export the full list of users for a given message step by clicking Export. This data is available for 30 days.Each user appears only once per tab. If a user re-enters and receives the same message multiple times, they will only appear once in the export for that step.
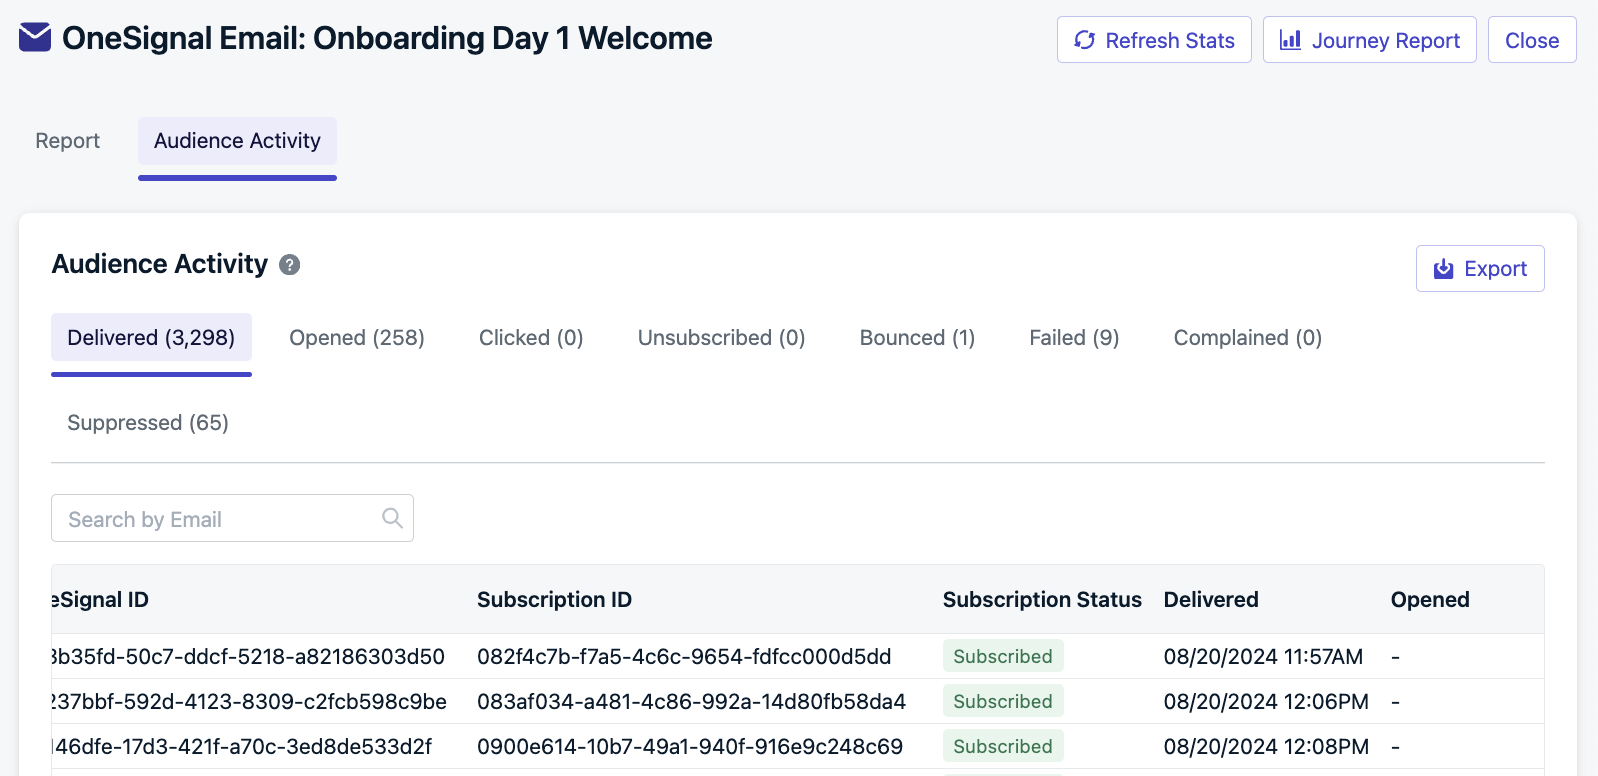
Audience activity report
Métriques de conversion
Bientôt disponible — Les métriques de conversion seront disponibles dans les rapports Journey. Une fois disponibles, vous verrez les conversions attribuées et influencées au niveau de la Journey et au niveau du message individuel.